Getting Started with Fast IoT Platform #
Introduction #
The purpose of this tutorial is to showcase the fundamental usage of the most widely used functionalities of ThingsBoard. By following this tutorial, you will be able to:
-
Connect your devices to ThingsBoard.
-
Transmit data from your devices to ThingsBoard.
-
Create real-time dashboards for end-users.
-
Set up thresholds and trigger alarms.
-
Send notifications via email, SMS, or other systems when new alarms are triggered.
For the purpose of simplicity, we will be using a temperature sensor to connect and visualize data.
Step 1. Provision Device #
To keep things simple, we will manually provision the device using the user interface (UI).
-
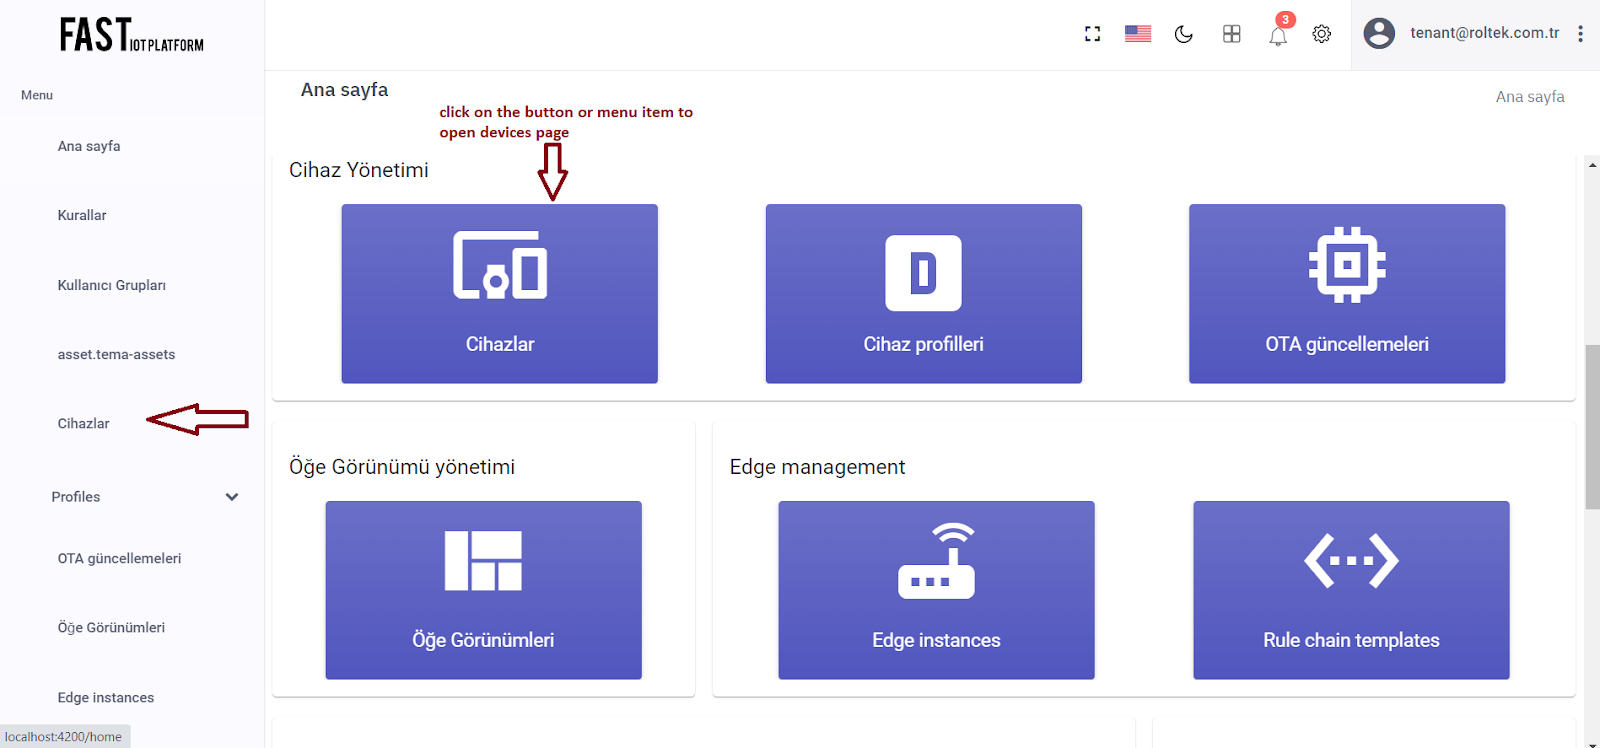
To begin, log in to your ThingsBoard instance and navigate to the Devices page.
-
Next, click on the “+” icon located at the top-right corner of the table and select “Add new device”. Enter the name of your device in the input field. For example, you can name it “My New Device”. No additional changes are required at this stage. Click on the “Add” button to add the device.
-
Once added, your device should appear at the top of the list, since the table sorts devices by the time of creation by default.
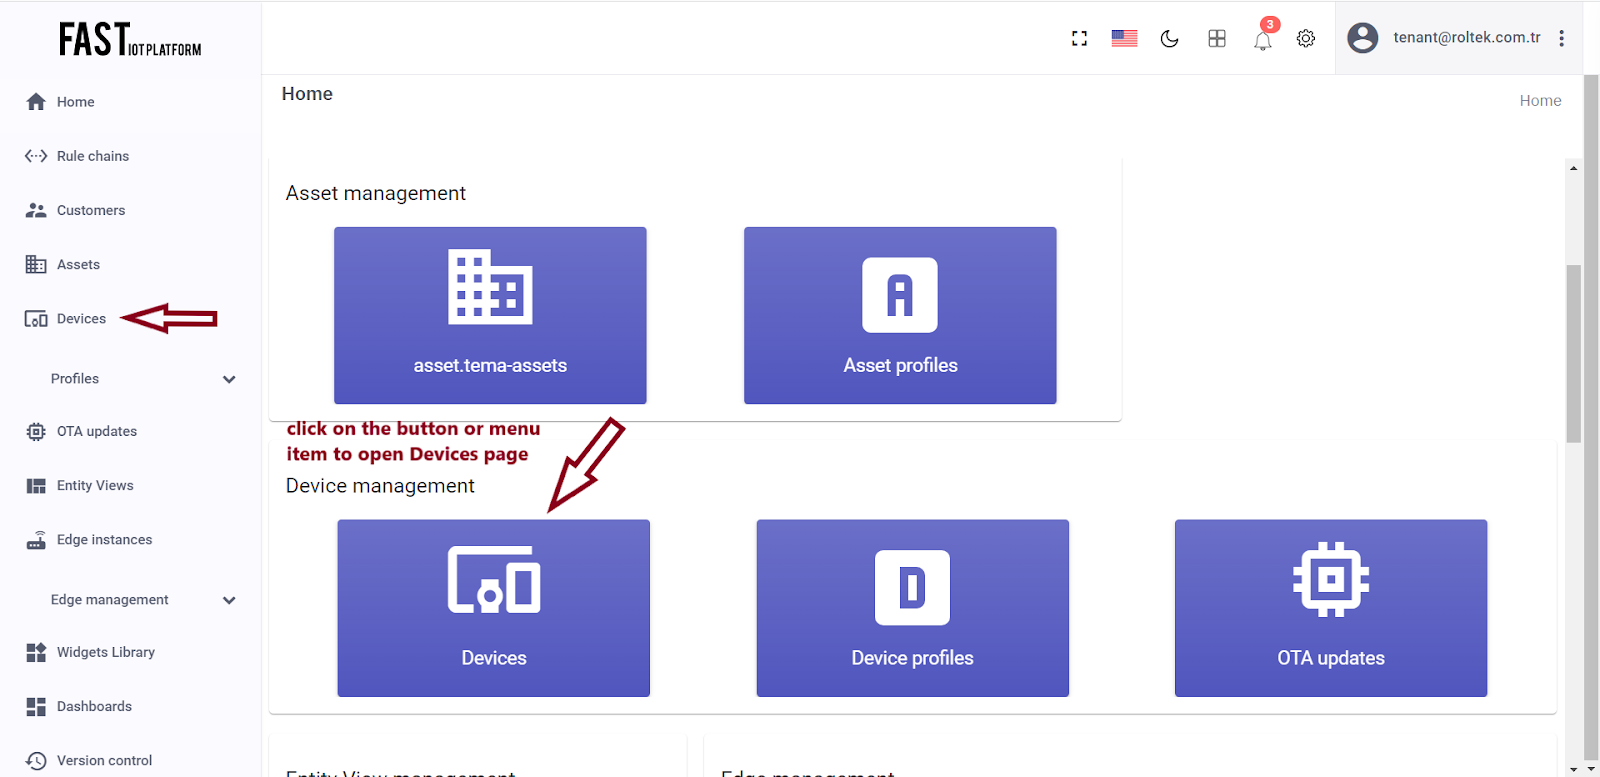
Fig. 1.1 – Go to the devices page from the home page.
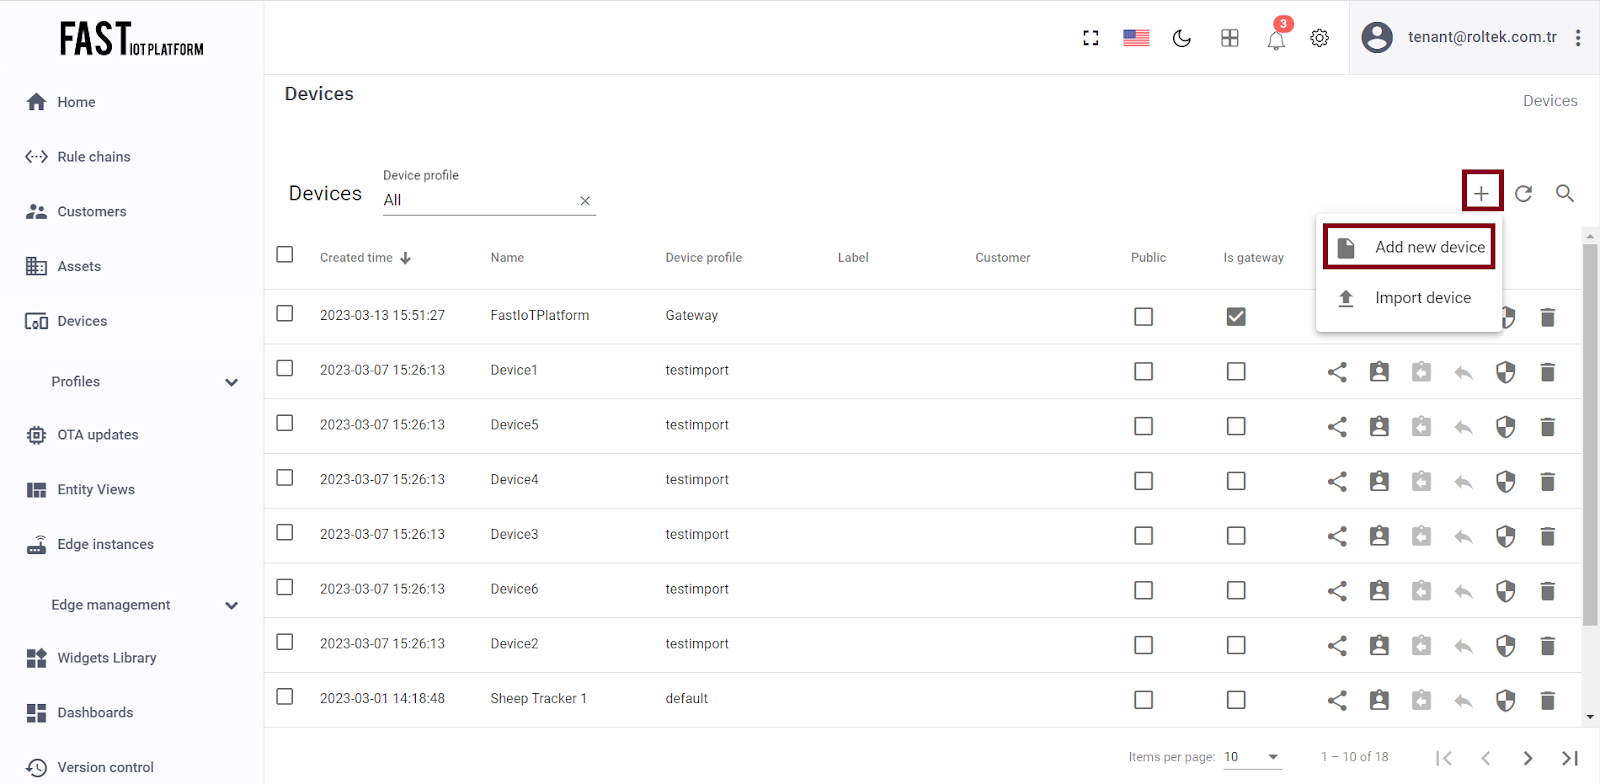
Fig. 1.2 – Click on the “+” icon located at the top right corner of the Devices page.
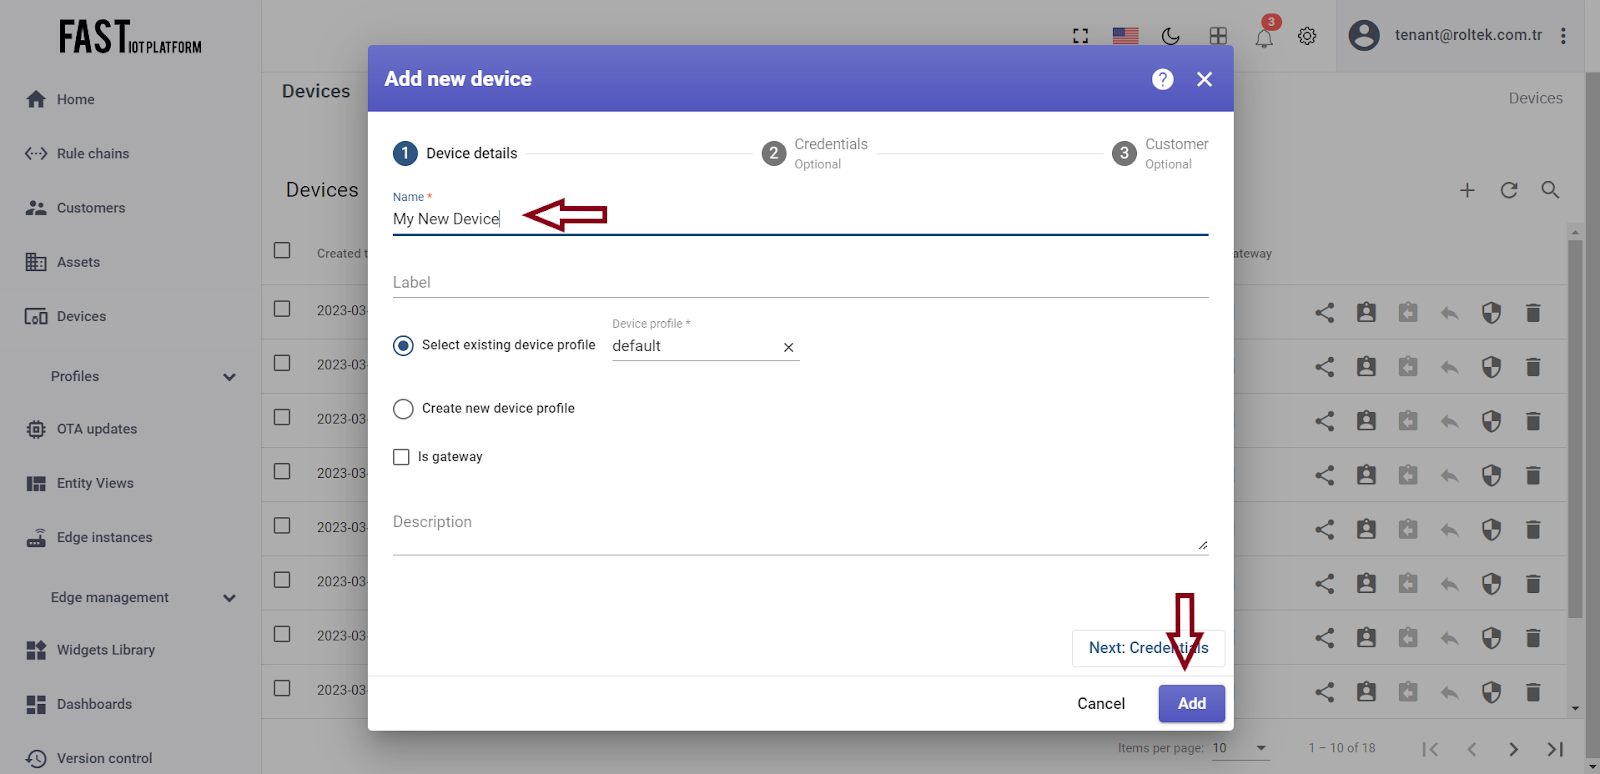
Fig. 1.3 – Enter the device name.
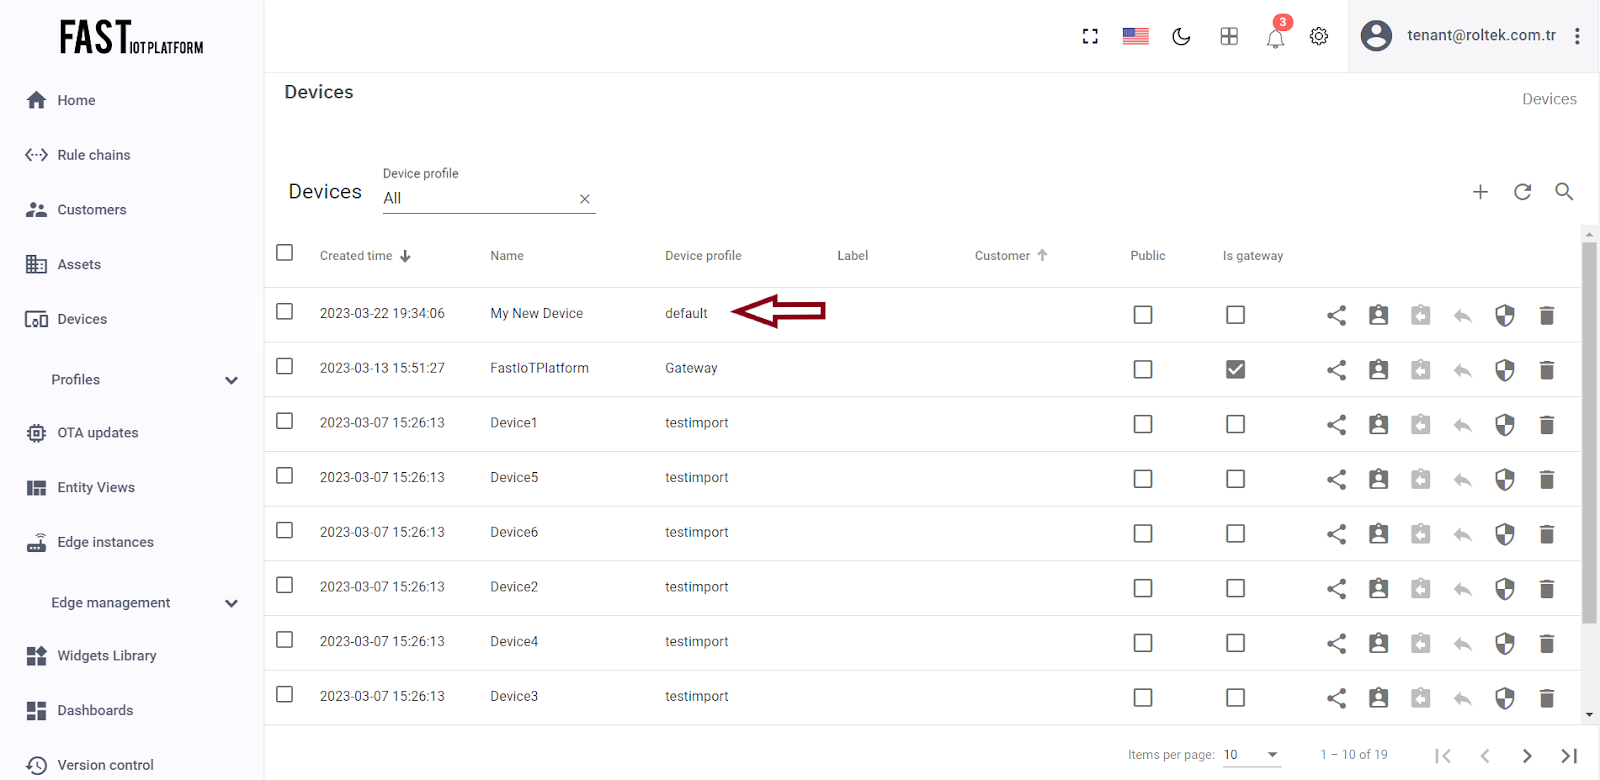
Fig. 1.4 – Once added, your device should appear at the top of the list, since the table sorts devices by the time of creation by default.
Additionally, you have the following options available:
-
Bulk provisioning: You can provision multiple devices by uploading a CSV file through the UI.
-
Device provisioning: You can enable device firmware to automatically provision the device, eliminating the need for manual configuration.
-
REST API: You can programmatically provision devices and other entities using the ThingsBoard REST API.
Step 2. Connect device #
Before connecting the device, you need to obtain its credentials. ThingsBoard supports various types of device credentials, but for the purpose of this guide, we recommend using the default auto-generated credentials, which is the access token.
To obtain the access token:
-
Click on the row corresponding to your device in the table to open its details.
-
Click on the “Copy access token” button. The token will be copied to your clipboard.
-
Save the access token to a safe location for later use.
Fig. 2.1 – Click on the row corresponding to your device in the table to open its details.
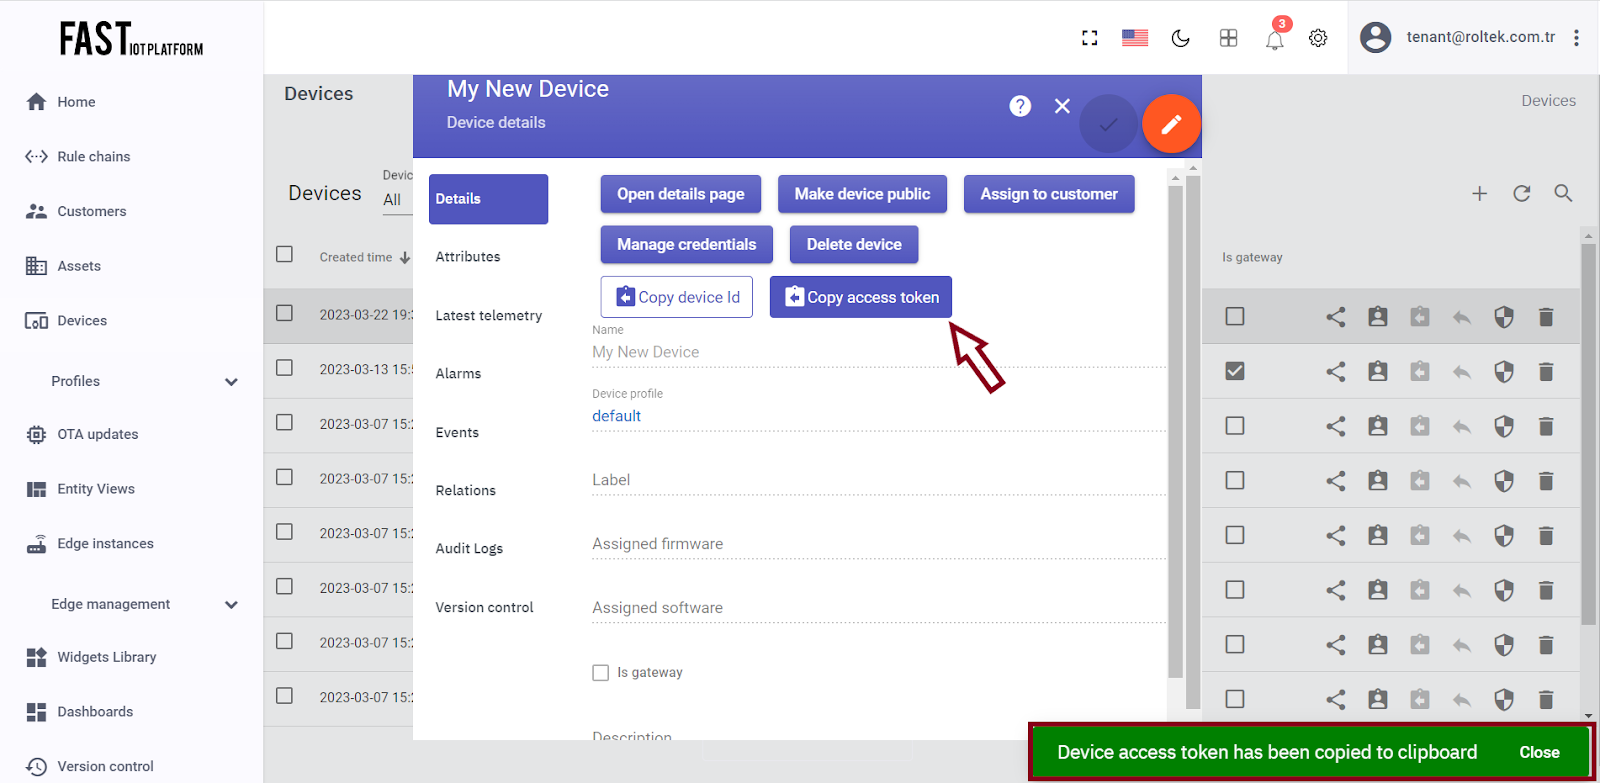
Fig. 2.2 – Click on the “Copy access token” button.
You are now ready to publish telemetry data on behalf of your device. In this example, we will use simple commands to publish data over HTTP or MQTT.
Step 3. Create Dashboard #
Next, we will create a dashboard and add the most commonly used widgets. Please follow the instructions below.
Step 3.1 Create Empty Dashboard #
To create a new dashboard and add widgets to it, please follow these steps:
-
Open the Dashboards page on ThingsBoard.
-
Click on the “+” icon located at the top right corner of the page, and select “Create new dashboard”.
-
Enter a name for your dashboard, such as “My New Dashboard”.
-
Click on the “Add” button to create the dashboard.
-
Your newly created dashboard should appear at the top of the list, as the table sorts dashboards by the time of creation by default.
-
Click on the “Open dashboard” icon to start adding widgets to your dashboard.
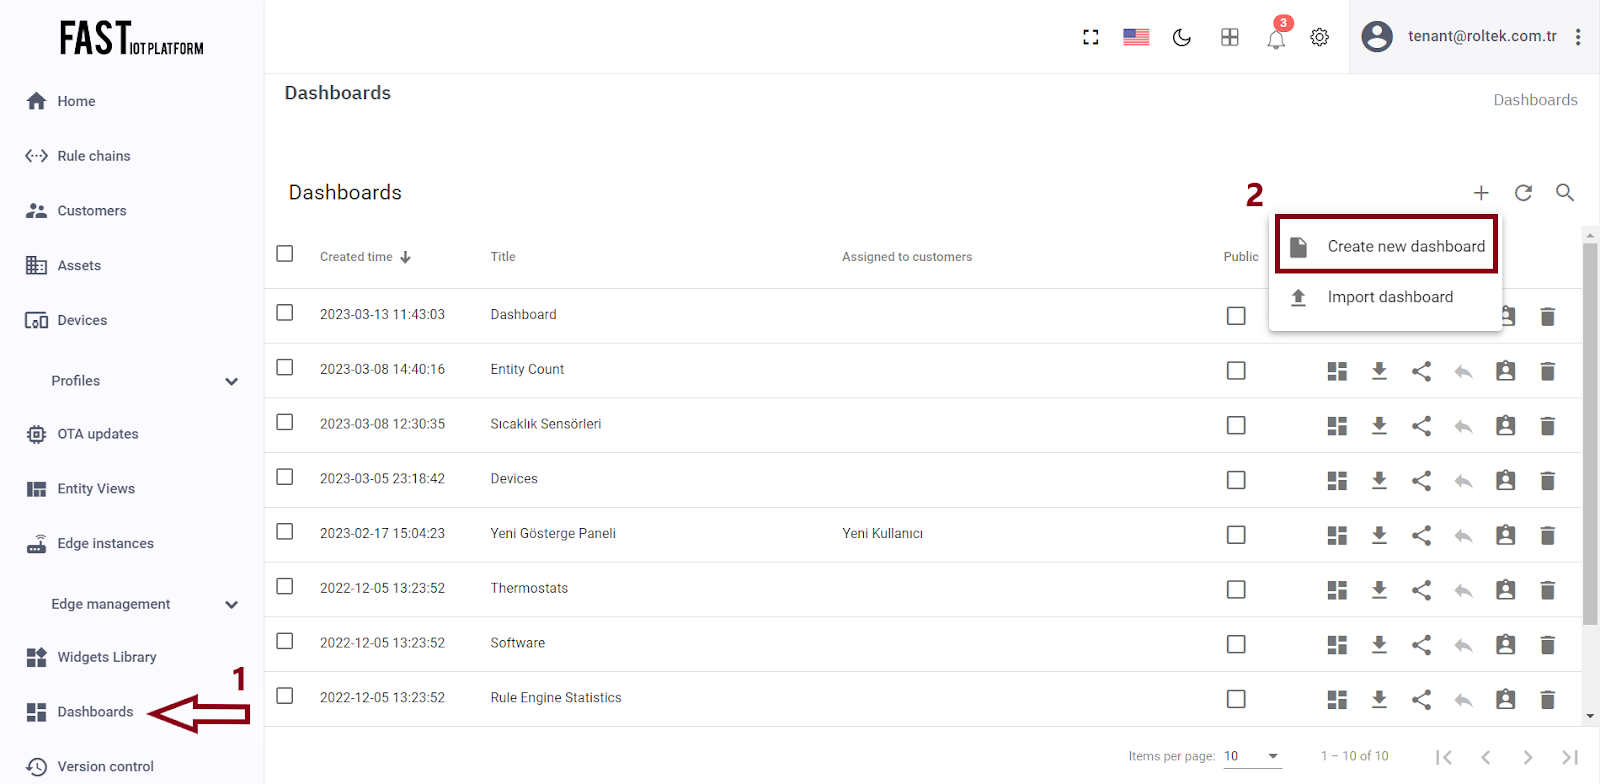
Fig. 3.1.1 – Open the Dashboards page. Select “Create new dashboard”.
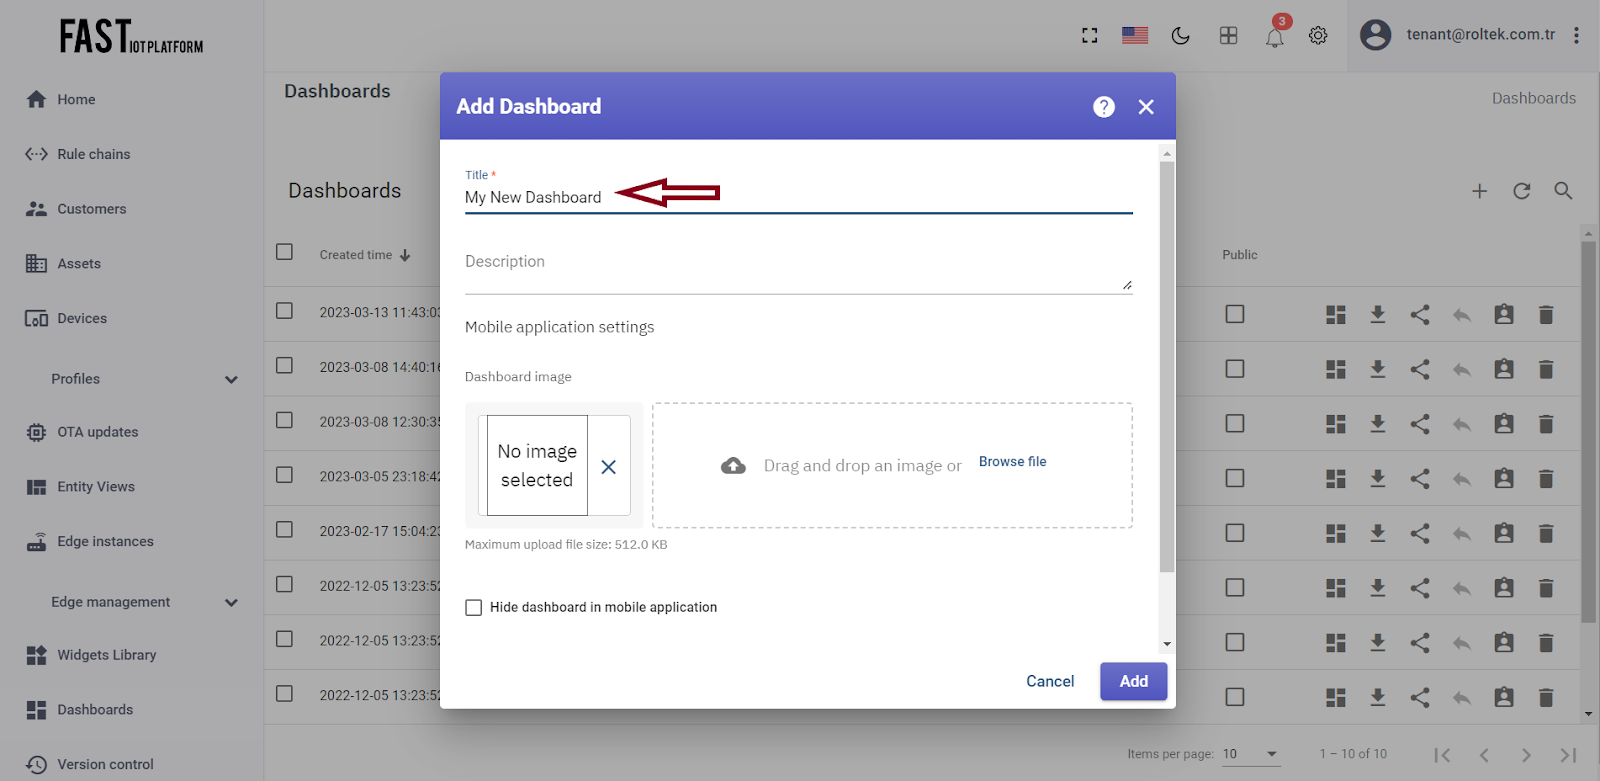
Fig. 3.1.2 – Input dashboard name.
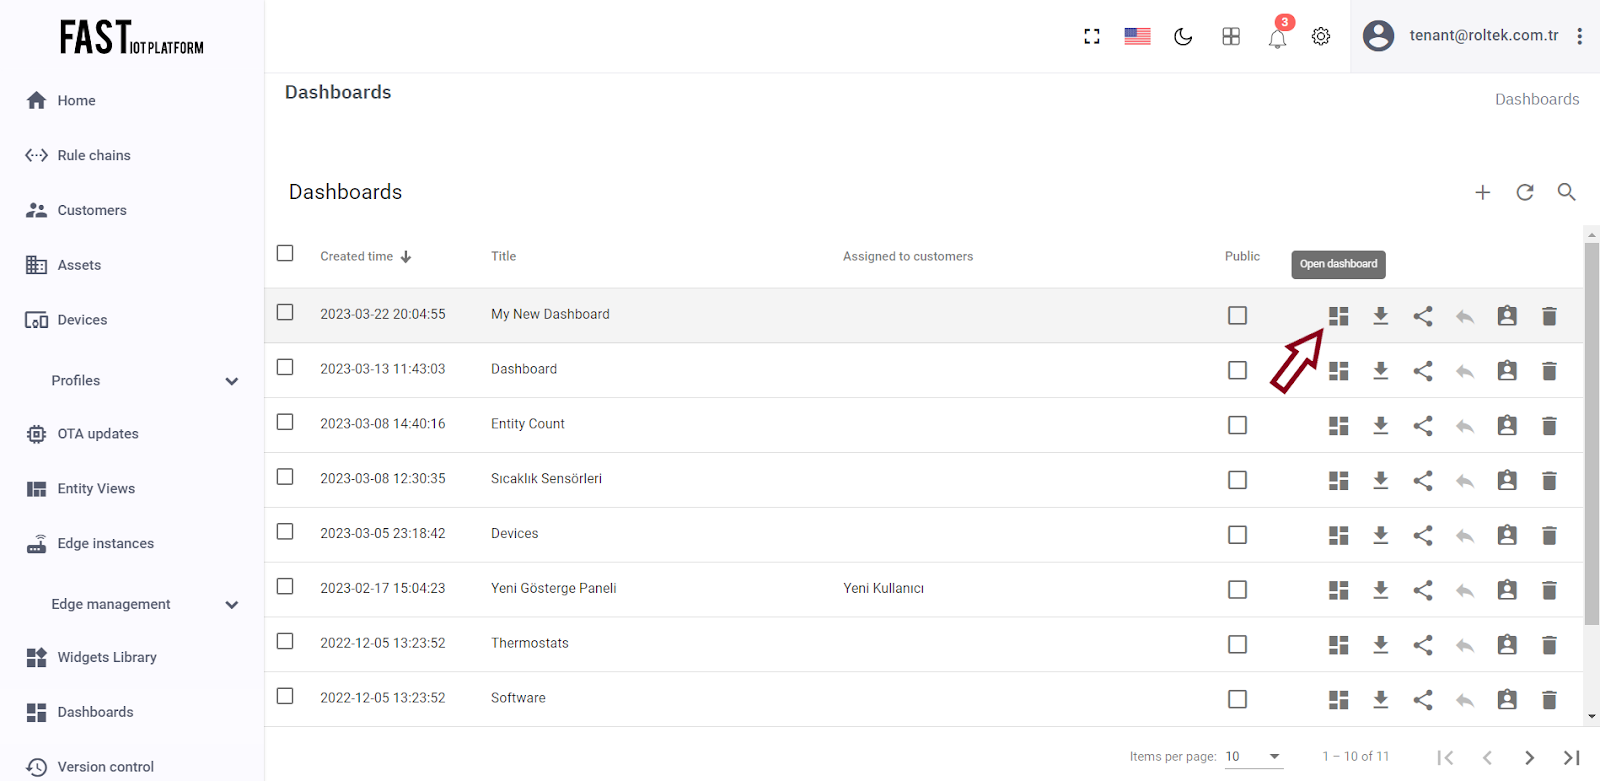
Fig. 3.1.3 – Click on the “Open dashboard” icon to start adding widgets to your dashboard.
Step 3.2 Add Entity Alias #
An alias is a reference to a single entity or group of entities that are used in widgets. Aliases can be either static or dynamic. For the purpose of simplicity, we will use a “Single entity” alias that references the one and only entity (“My New Device” in our case). However, it is possible to configure an alias that references multiple devices, such as devices of a certain type or those related to a specific asset. You can learn more about different aliases here.
To add an alias to your dashboard, please follow these steps:
-
Enter edit mode by clicking on the pencil button located in the bottom right corner of the screen.
-
Click on the “Entity Aliases” icon located at the top right corner of the screen. This will display an empty list of entity aliases.
-
Click on the “Add alias” button.
-
Enter an alias name, such as “MyDevice”.
-
Select “Single entity” as the filter type.
-
Select “Device” as the type, and type “My New” to enable autocomplete. Choose your device from the list of autocomplete options, and click on it.
-
Click on the “Add” button, followed by the “Save” button.
-
Finally, click on the “Apply changes” button in the dashboard editor to save your changes. You will then need to enter edit mode again.
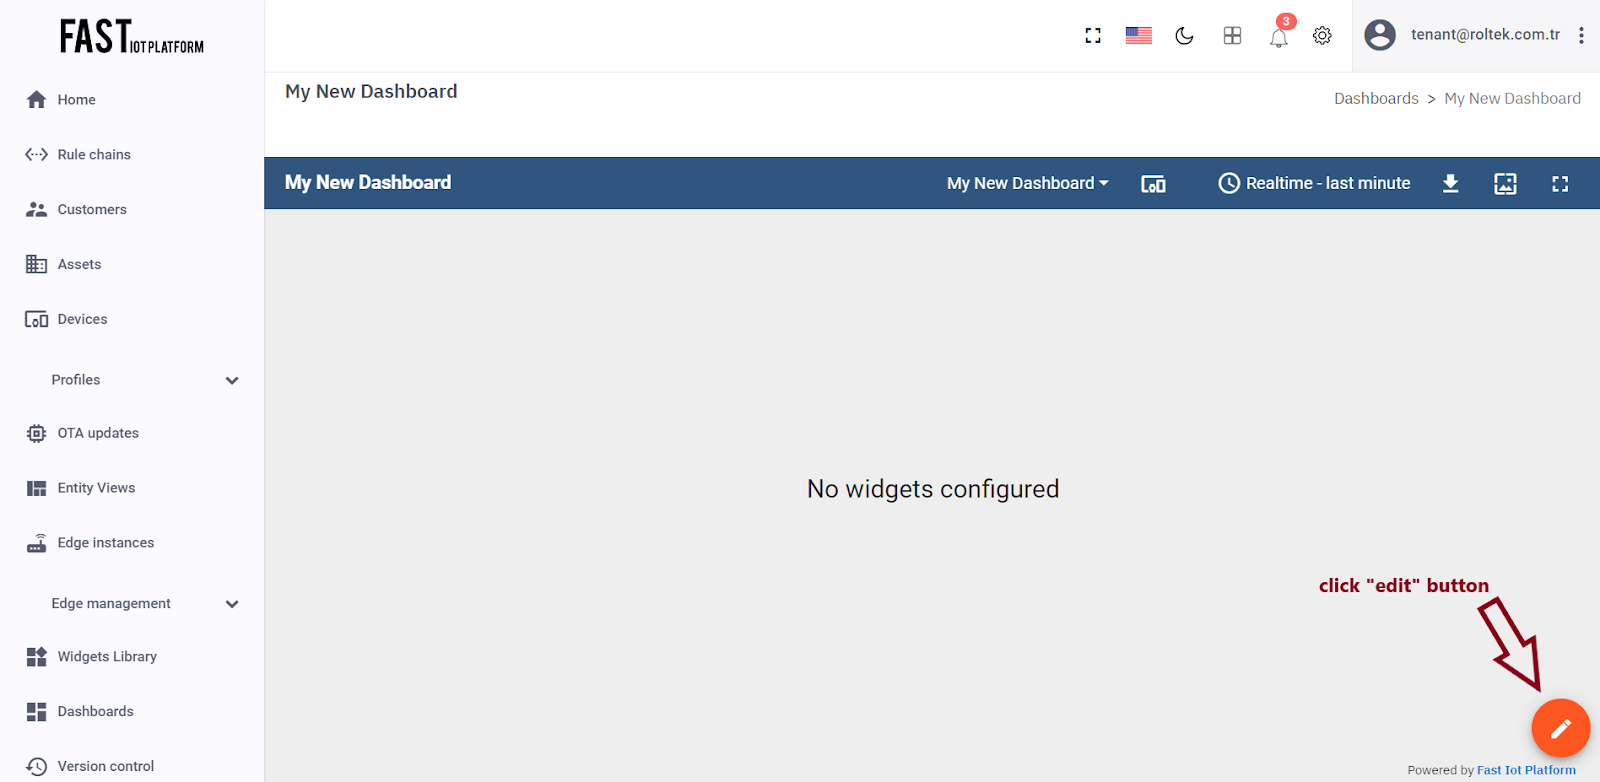
Fig. 3.2.1 – Enter edit mode.
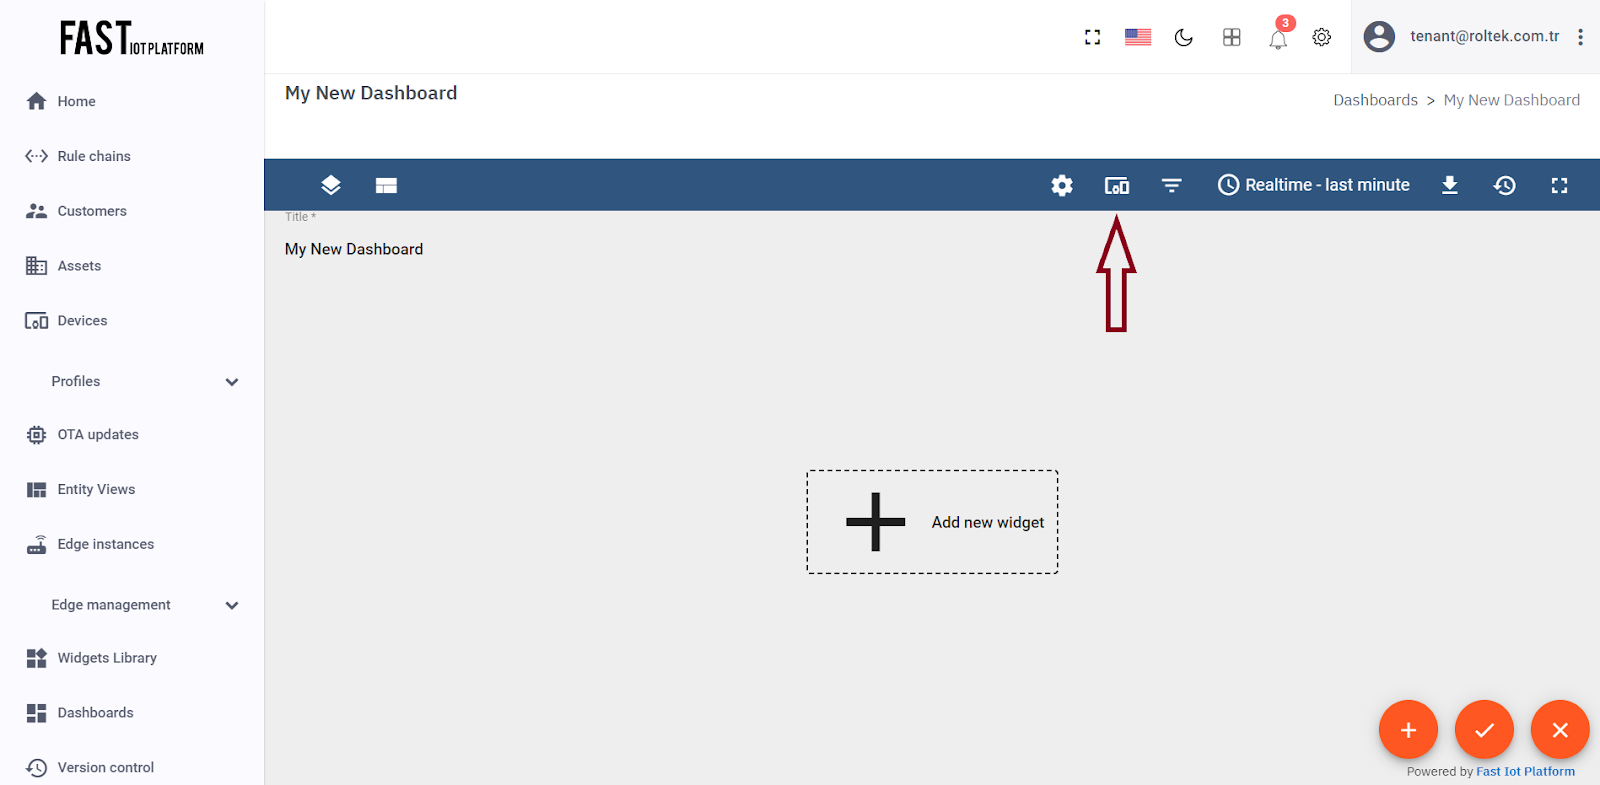
Fig. 3.2.2 – Click on the “Entity Aliases” icon located at the top right corner of the screen.
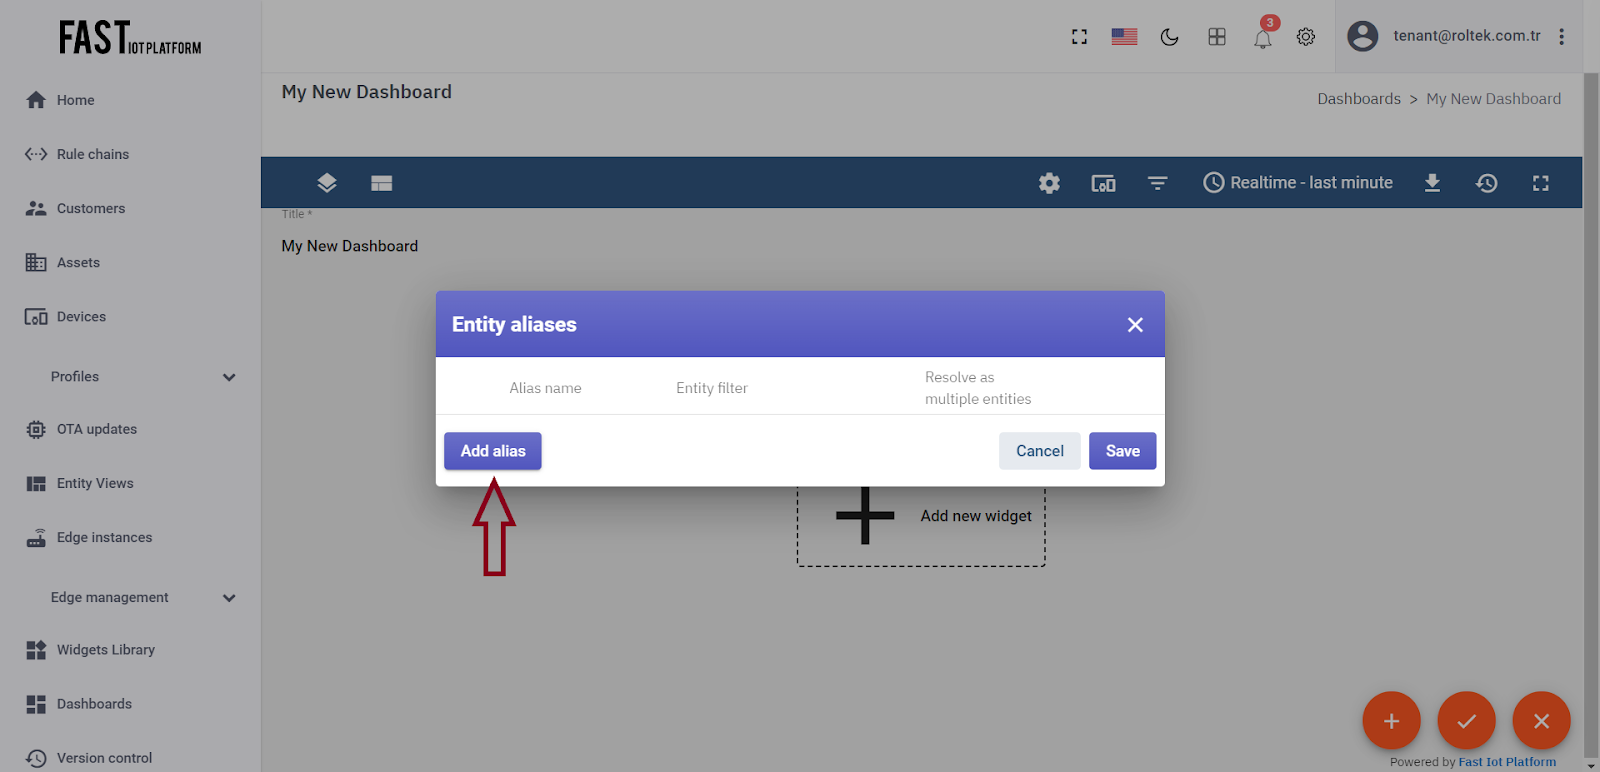
Fig. 3.2.3 – Click on the “Add alias” button.
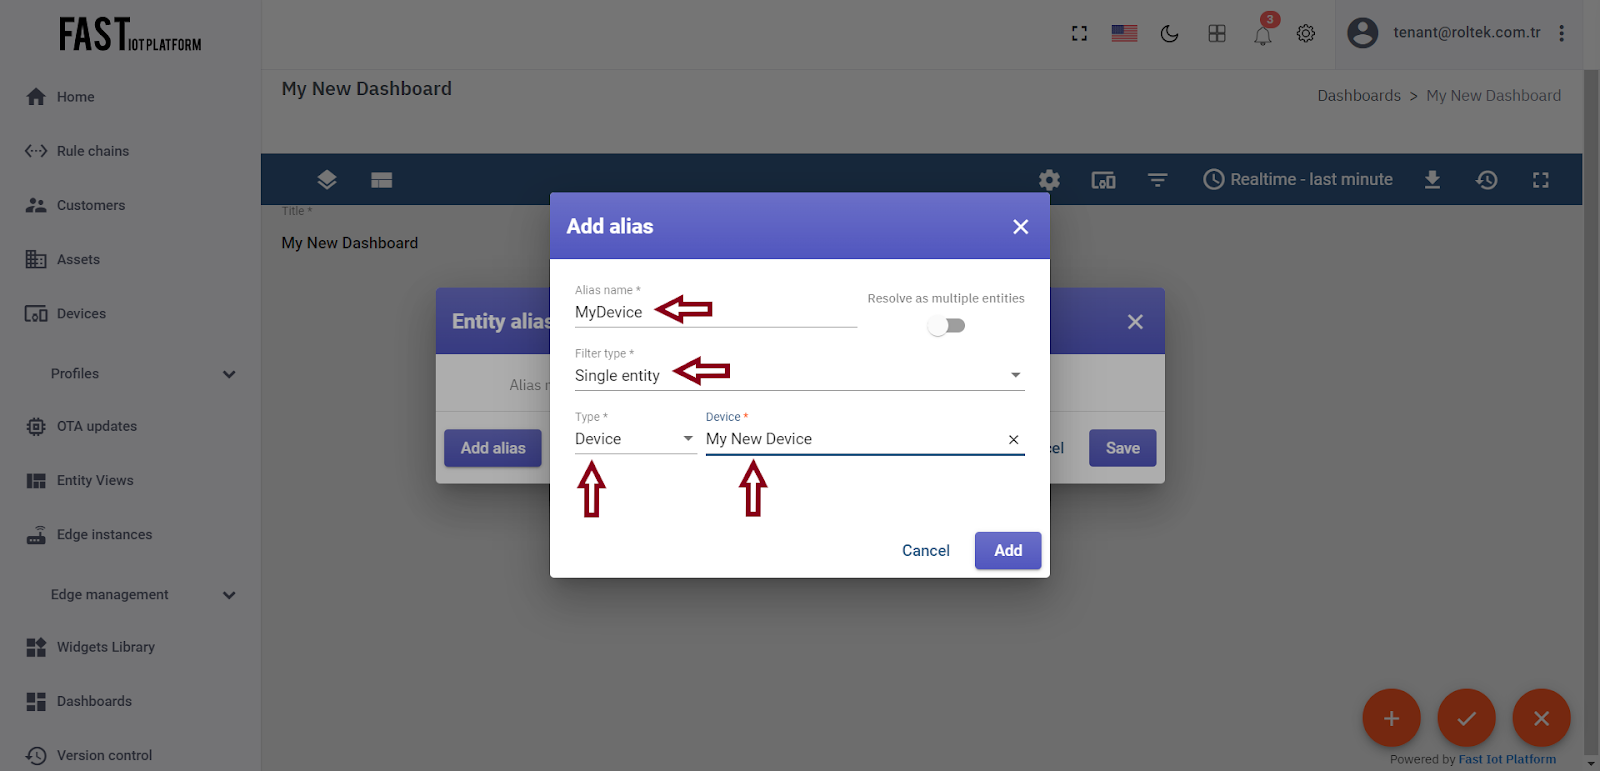
Fig. 3.2.4 – Select “Device” as the type, and type “My New” to enable autocomplete. Choose your device from the list of autocomplete options, and click on it.
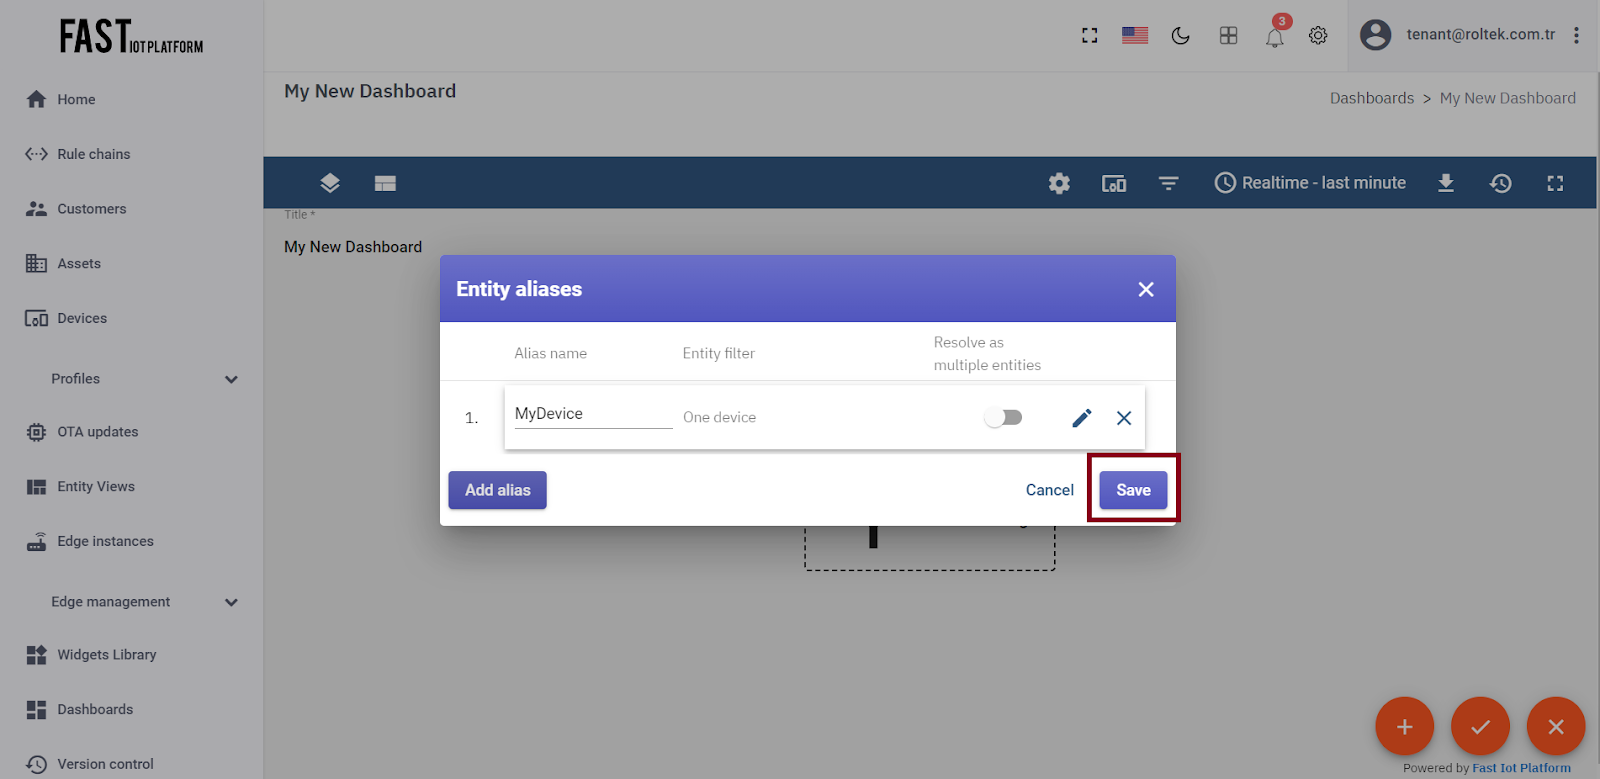
Fig. 3.2.5 – Click “Add” and then “Save”.
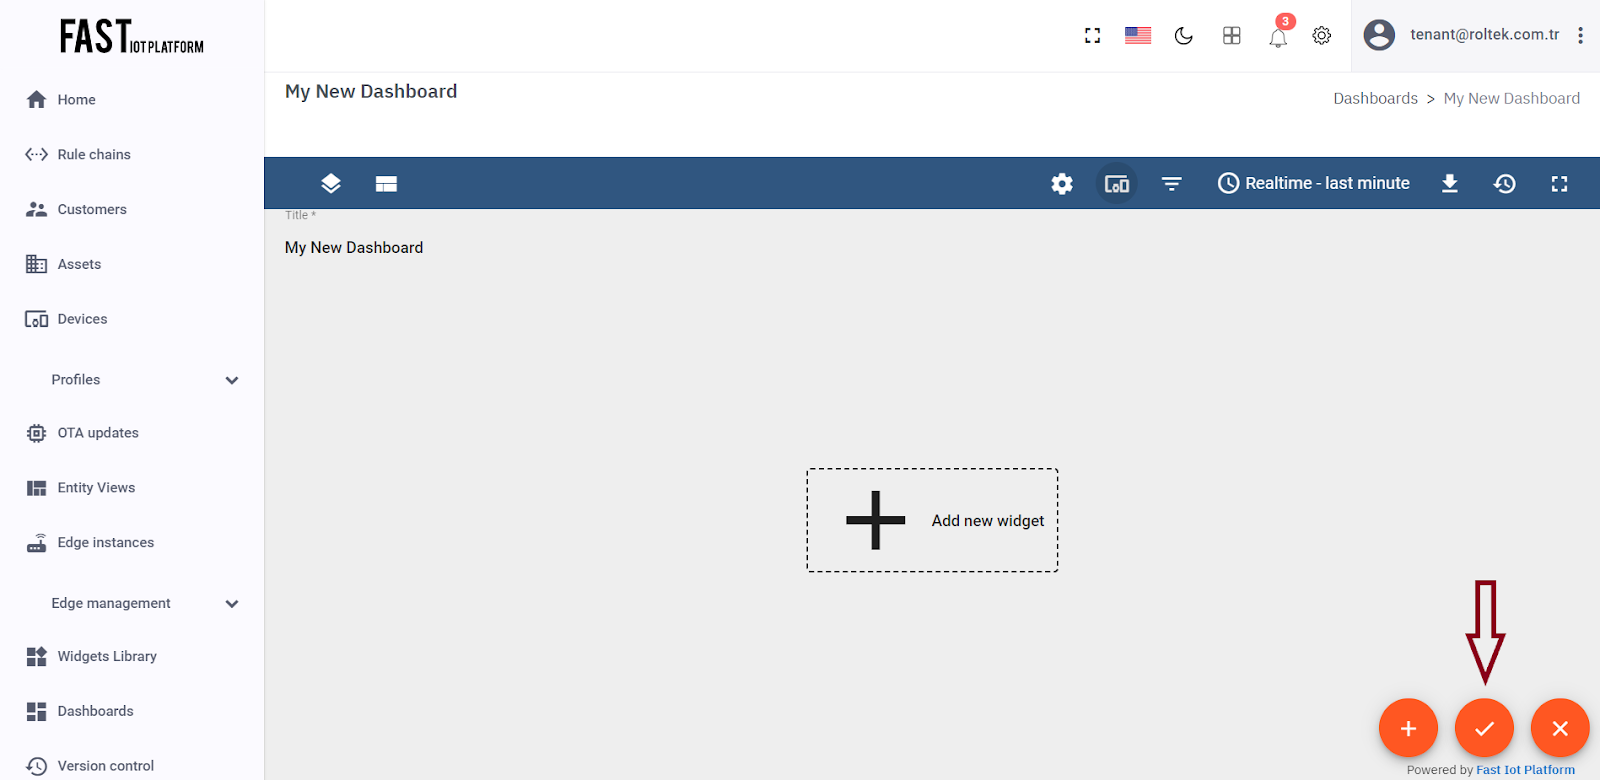
Fig. 3.2.6 – Finally, click on the “Apply changes” button in the dashboard editor to save your changes.
Step 3.3 Add Table Widget #
In order to incorporate the table widget, we must access the widget library and select it from there. The widgets are organized into widget bundles, with each widget having its own data source that informs it what data to display. To display the most recent temperature value we sent in Step 2, we must configure the data source accordingly.
-
First, enter edit mode and click on the “Add new widget” button. Next, select the “Cards” widget bundle and go to the “Latest values” tab. From there, click on the header of the Entities widget to bring up the “Add Widget” window.
-
To add the data source, click “Add”. While a widget may have multiple data sources, we will use only one in this case. Select the “MyDevice” entity alias, then click on the input field on the right. An auto-complete function will appear, allowing you to select the available data points. Select the “temperature” data point and click “Add”.
-
Finally, resize the widget by dragging the bottom right corner to make it slightly larger. If you desire, you may also experiment with the advanced settings to modify the widget.
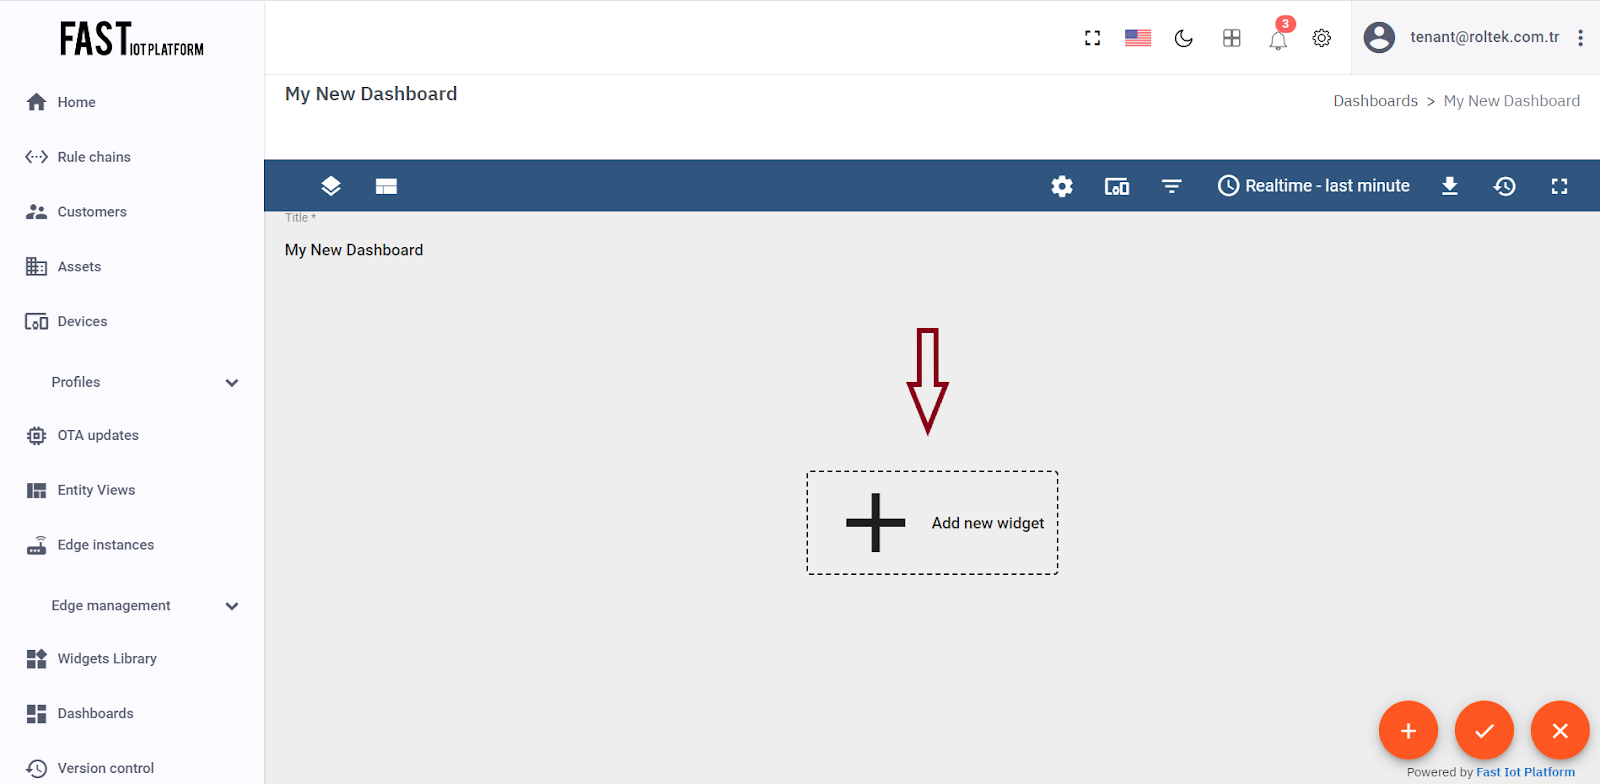
Fig. 3.3.1 – Enter edit mode. Click on the “Add new widget” button.
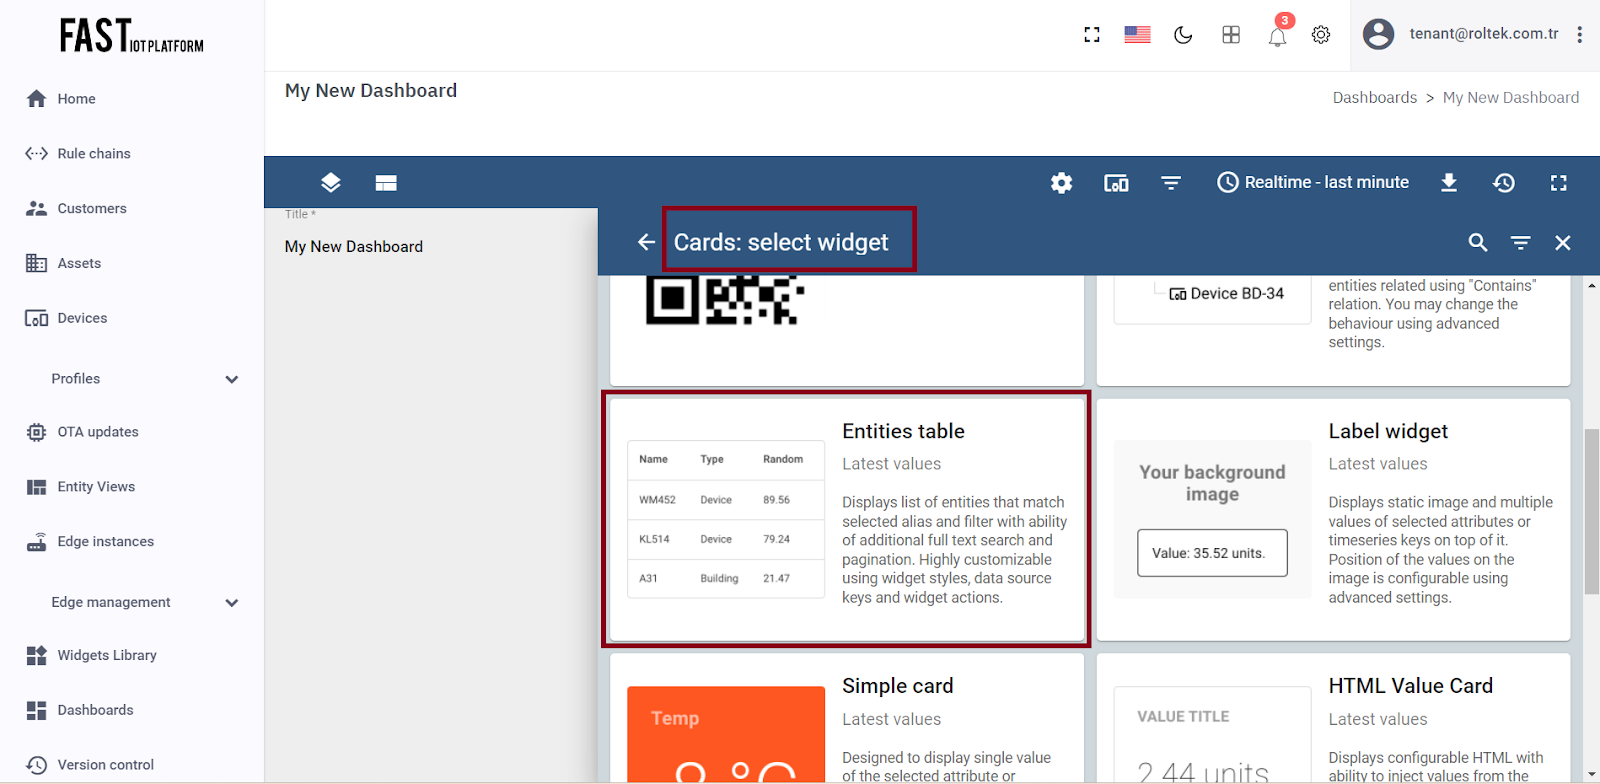
Fig. 3.3.2 – Select the Cards package and then choose the Entities table indicator.
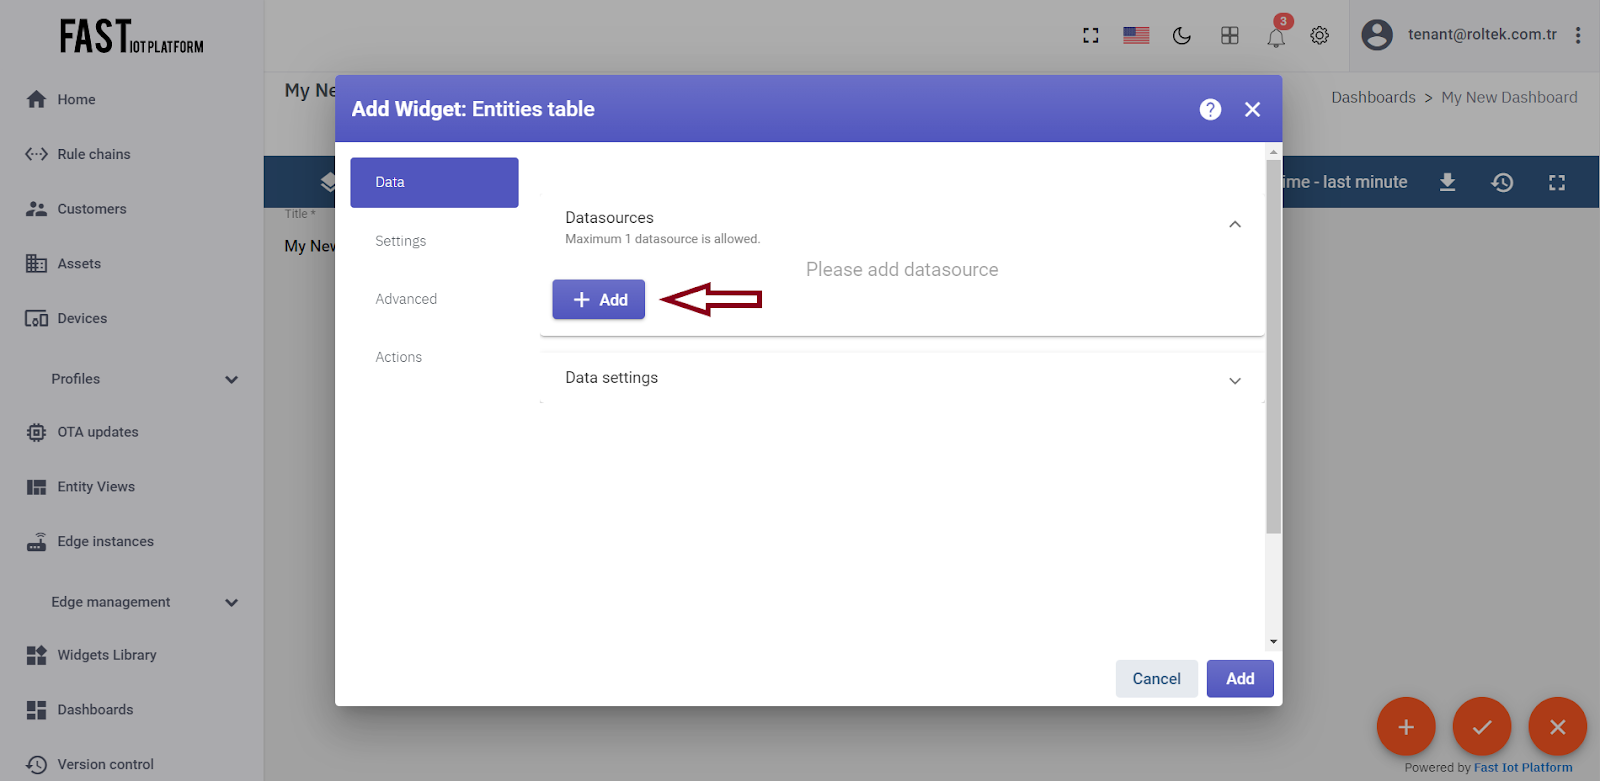
Fig. 3.3.3 – Click “Add” to add the data source.
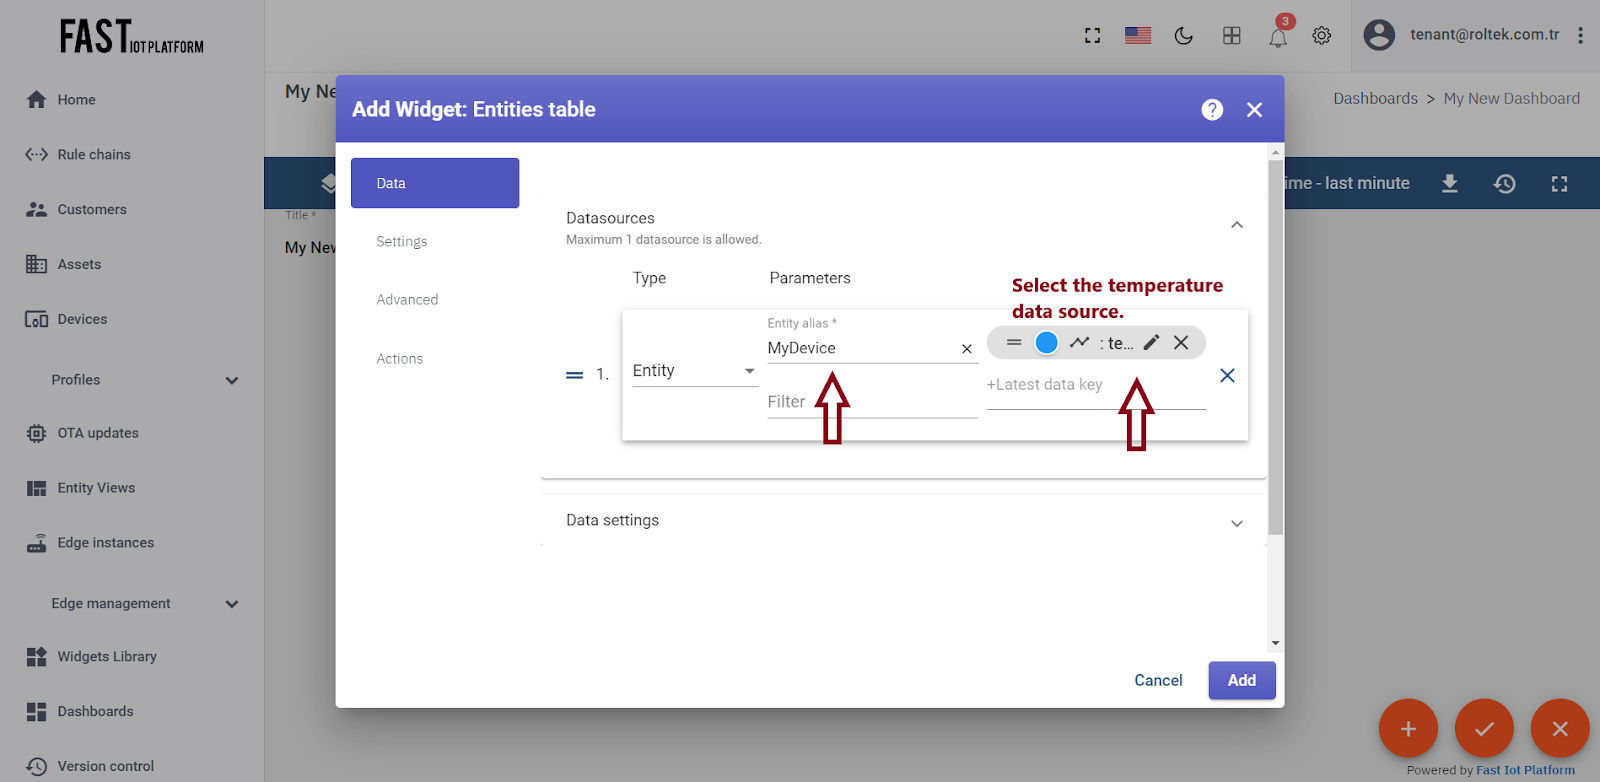
Fig. 3.3.4 – Select “MyDevice” entity alias. Select “temperature” data point and click “Add”.
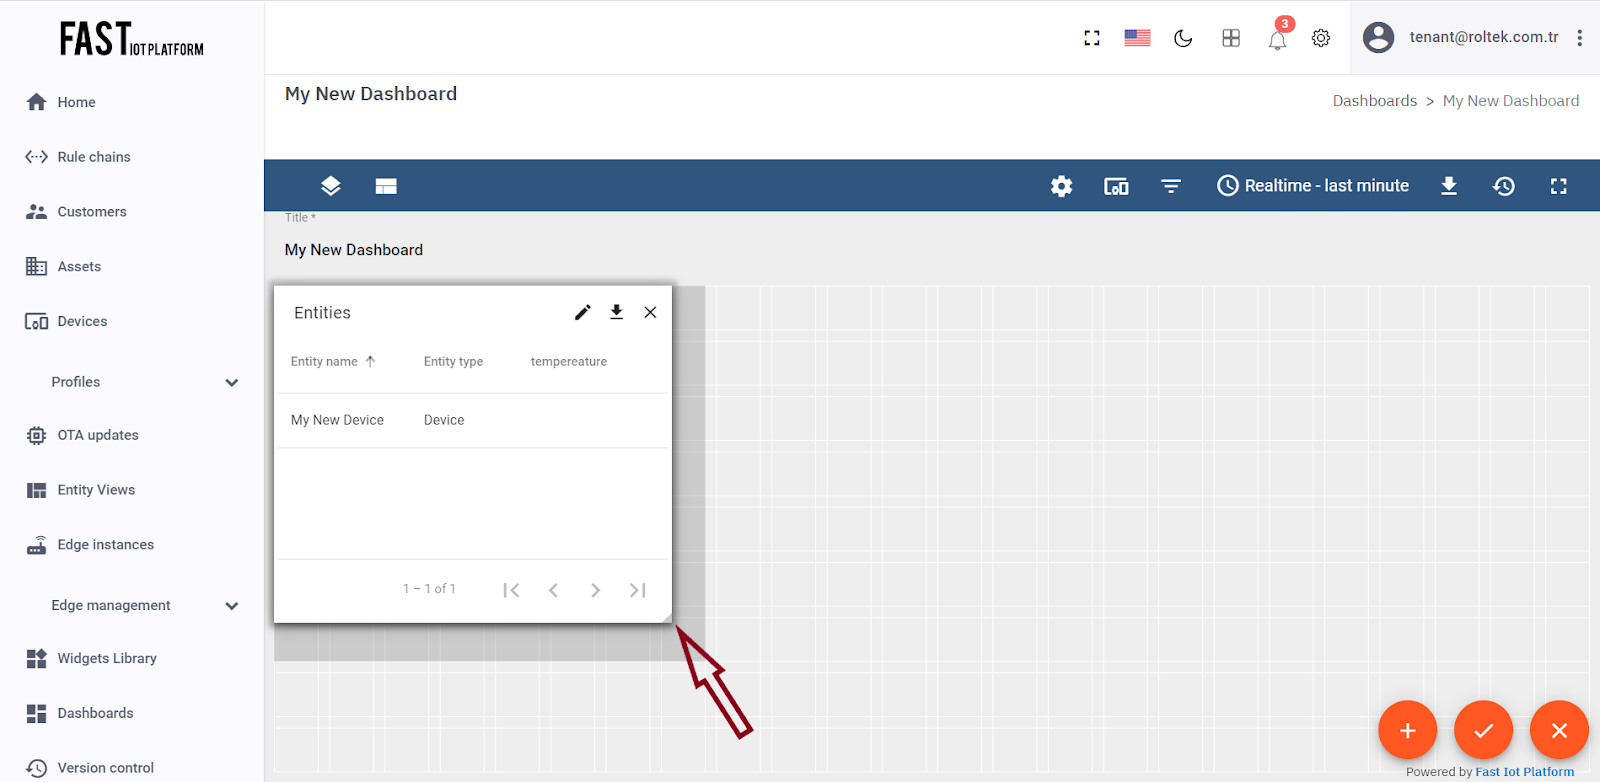
Fig. 3.3.5 – Resize the widget to make it a little bigger.
Congratulations on adding your first widget! You can now send new telemetry readings and they will instantly appear in the table.
Step 3.4 Add Chart Widget #
In order to include the chart widget, we need to access the widget library and select the appropriate one. This widget is designed to display various historical values of a specific data key, such as “temperature.” Additionally, we must configure the time window that the chart widget will use. Here are the steps to accomplish this task:
-
Enter Edit mode on the screen where you wish to add the chart widget.
-
Click on the “Add new widget” icon located in the bottom right corner of the screen.
-
Choose the “Create new widget” icon.
-
Locate the “Charts” bundle and select it. Scroll down and click on the “Timeseries – Flot” chart widget.
-
Press the “Add Datasource” button.
-
Choose the “MyDevice” Alias and then select the “temperature” key. Click “Add.”
-
Drag and drop the widget to the desired location on the screen. Resize the widget as needed, and then apply any changes.
-
Publish various telemetry values multiple times, making note that the widget only displays one minute of data by default.
-
Re-enter Edit mode and open the time selection window.
-
Modify the interval and aggregation function as desired. Update the time window and apply changes as needed.
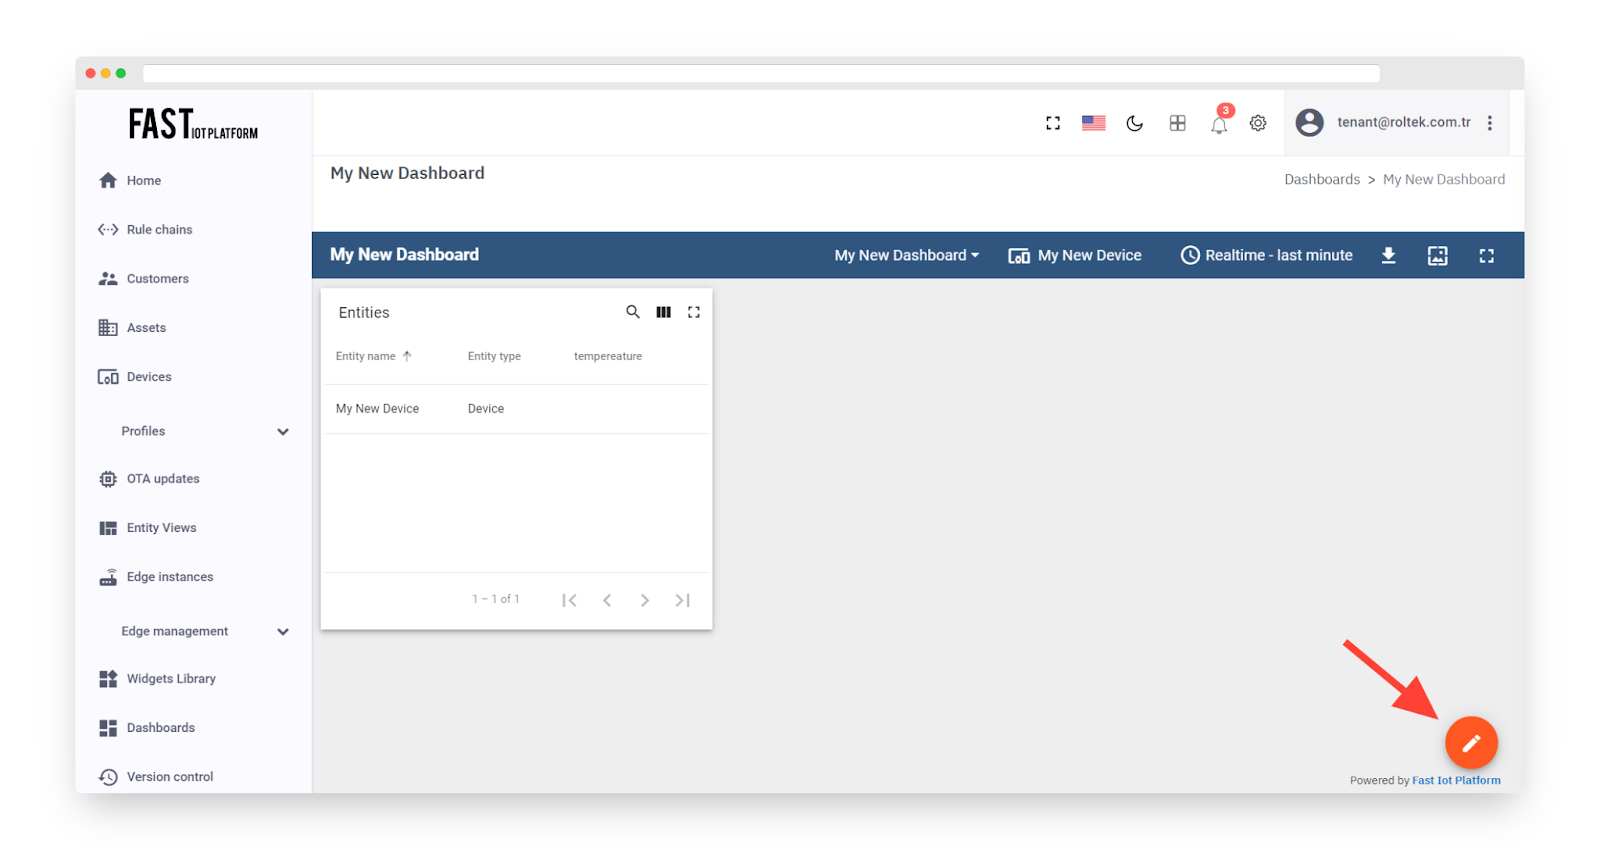
Fig. 3.4.1 – Enter Edit mode.
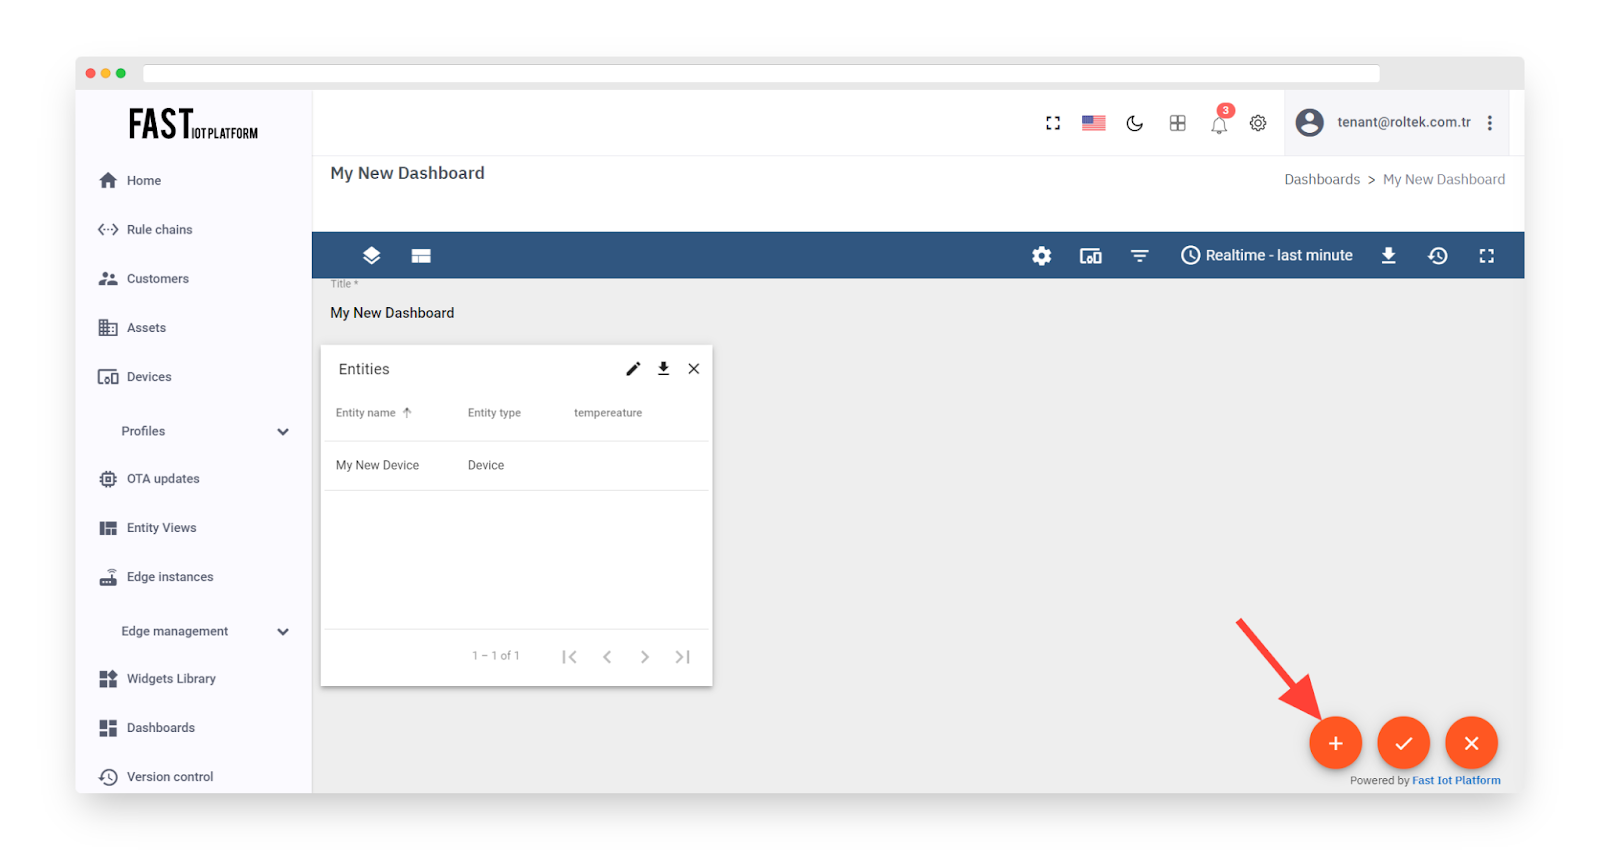
Fig. 3.4.2 – Click the “Add new widget” icon.
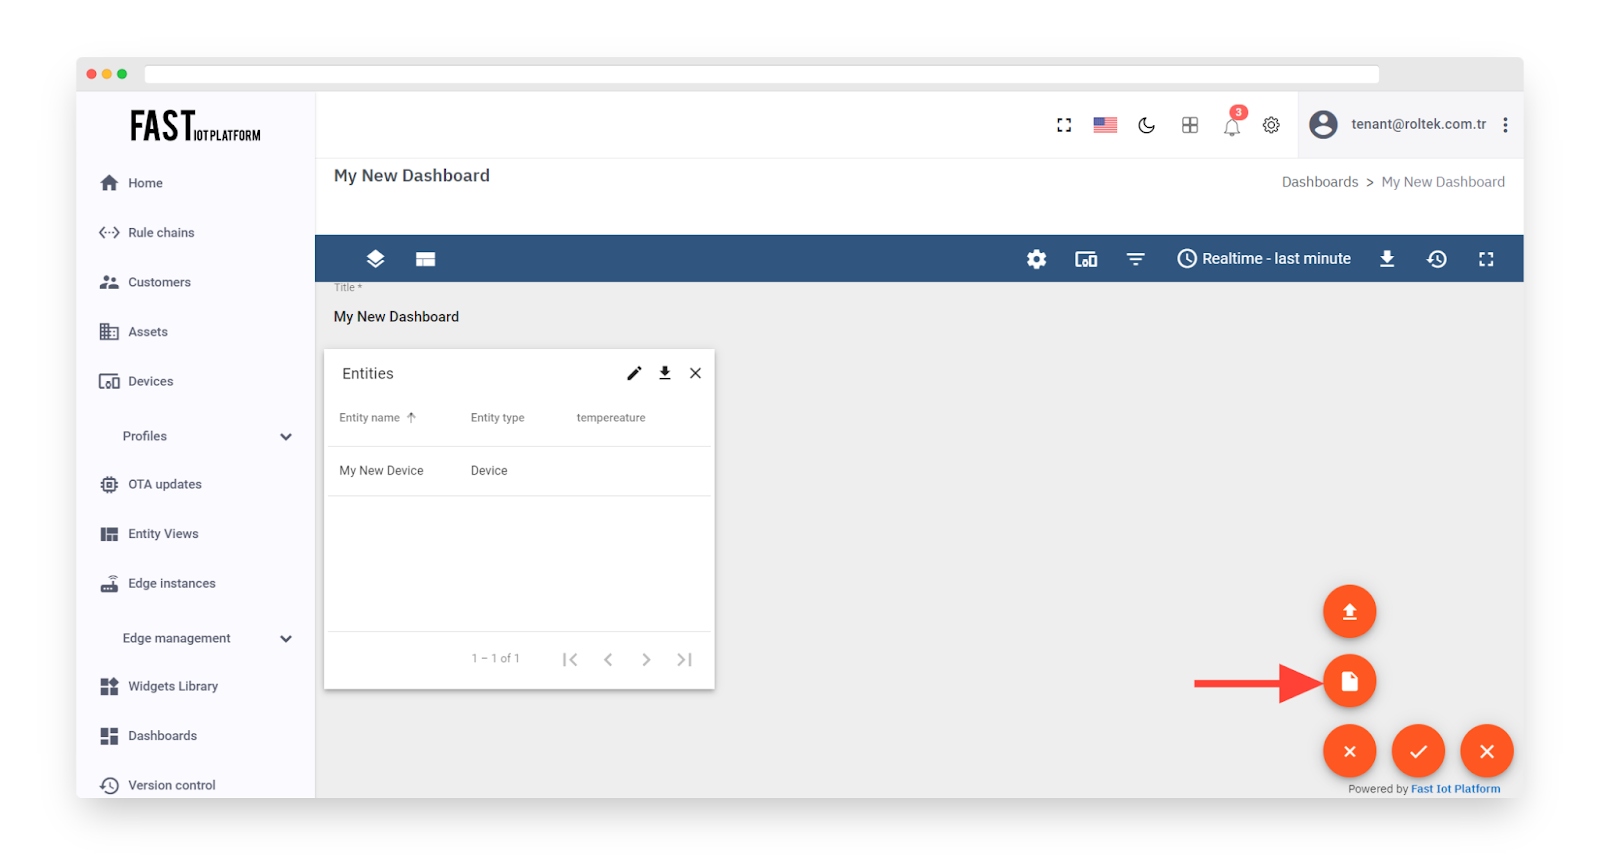
Fig. 3.4.3 – Choose the “Create new widget” icon.
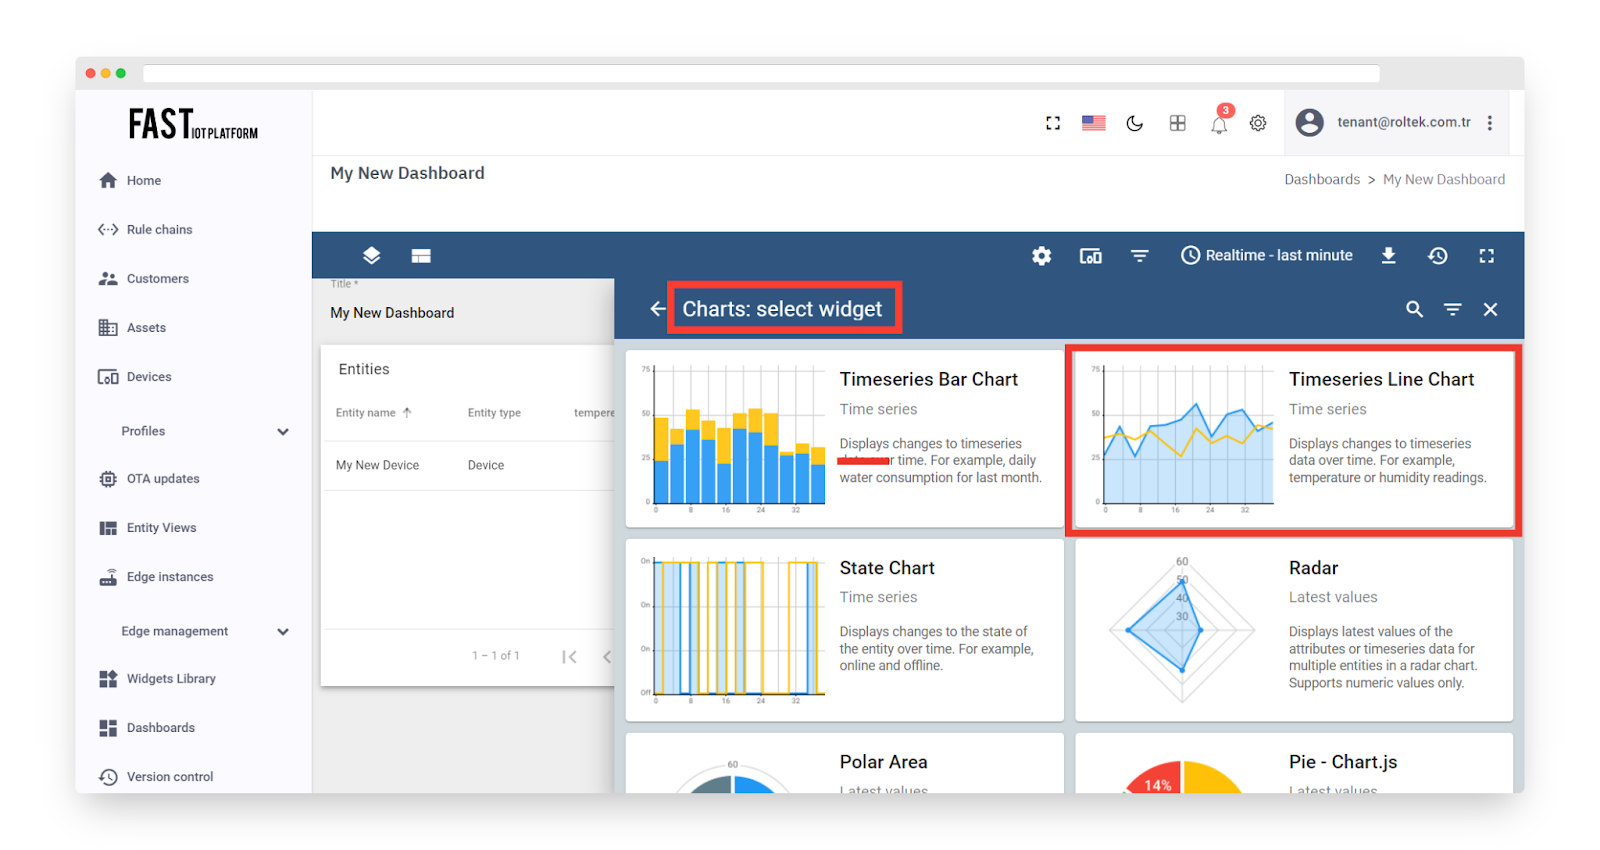
Fig. 3.4.4 – Select the “Charts” bundle and click on the “Timeseries Line Chart” chart widget.
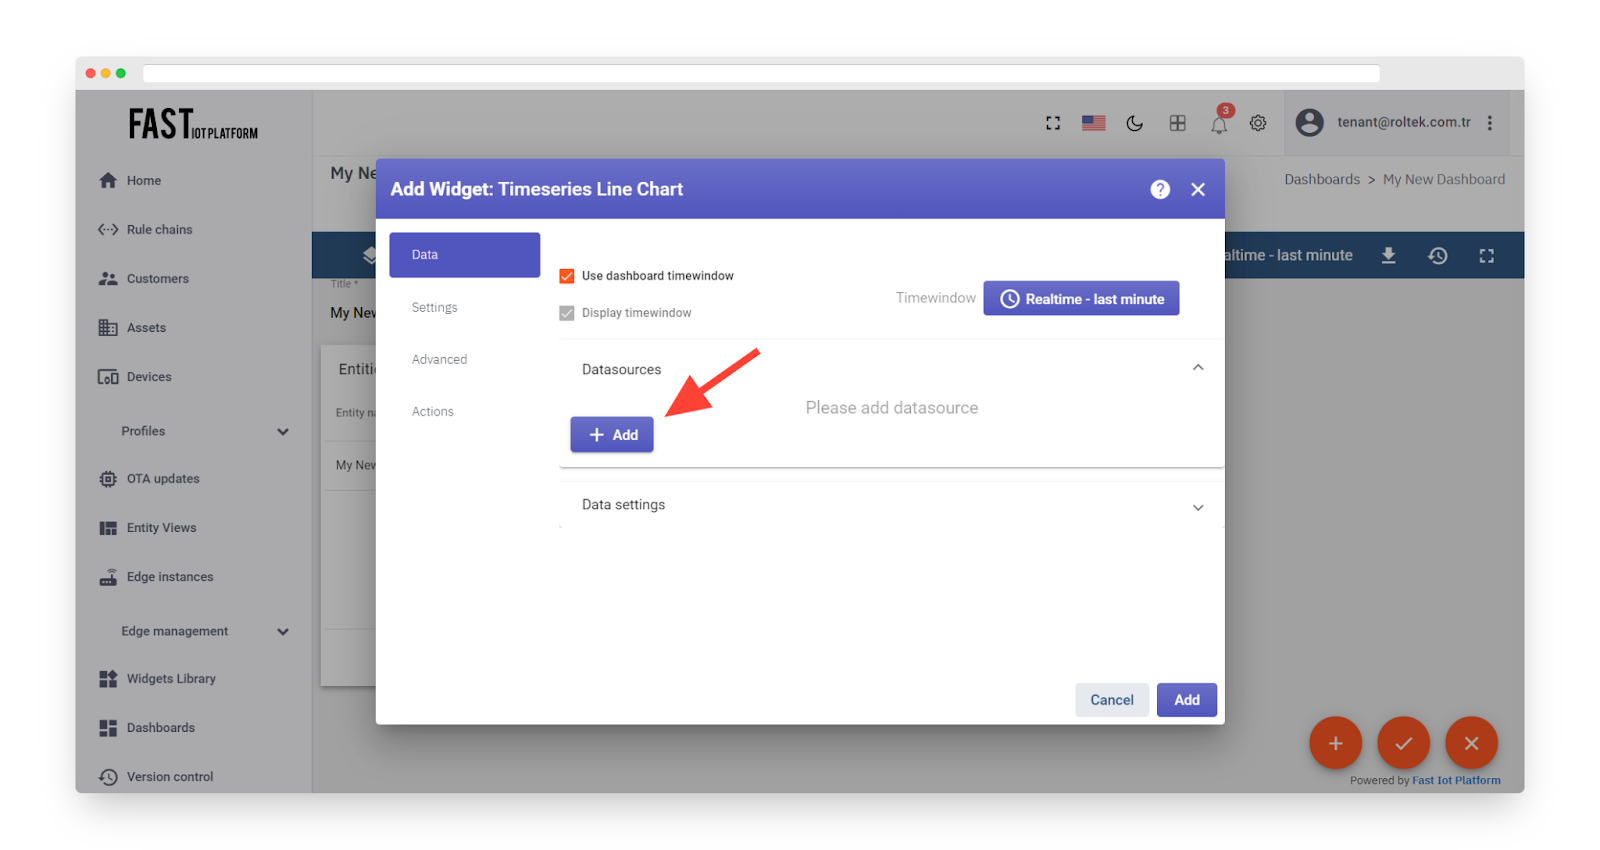
Fig. 3.4.5 – Click the “Add Datasource” button.
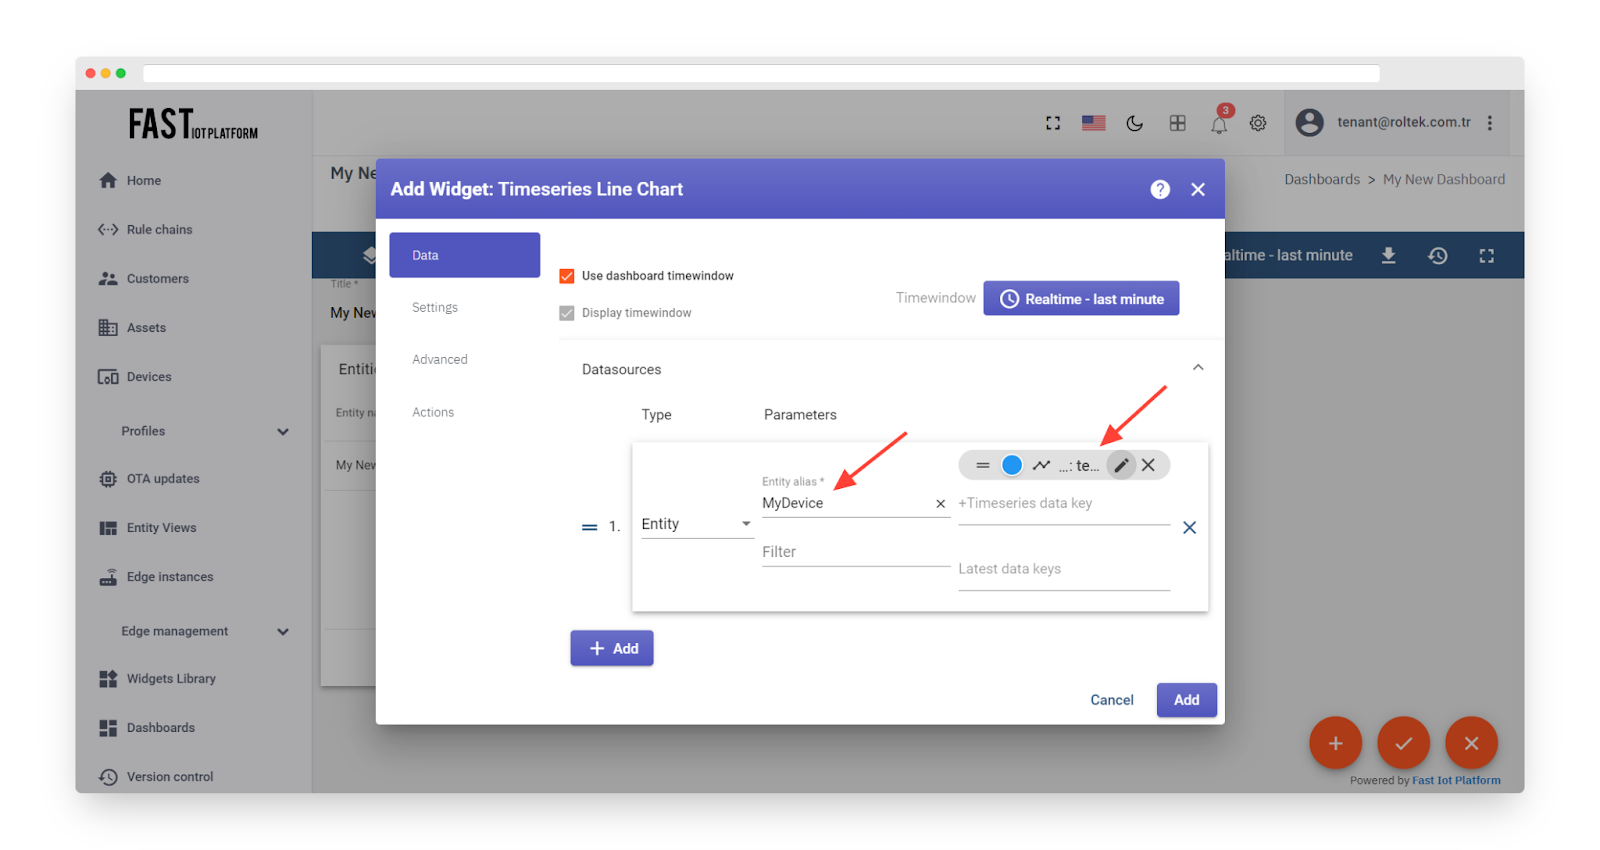
Fig. 3.4.6 – Select “MyDevice” Alias. Select or create the “temperature” key.
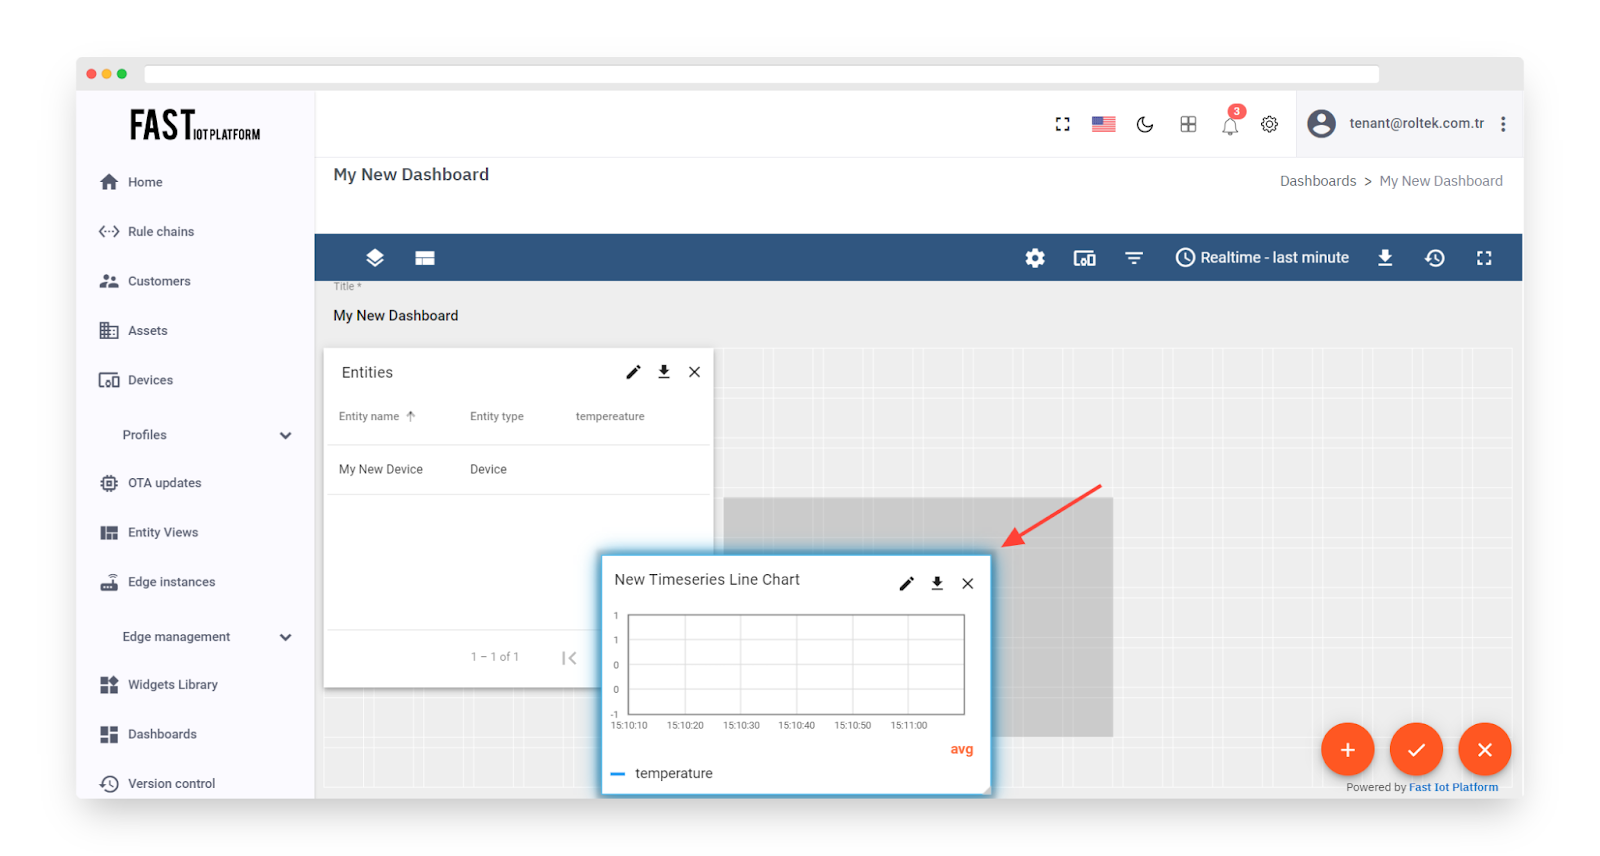
Fig. 3.4.7 – Drag and Drop your widget to the desired space.
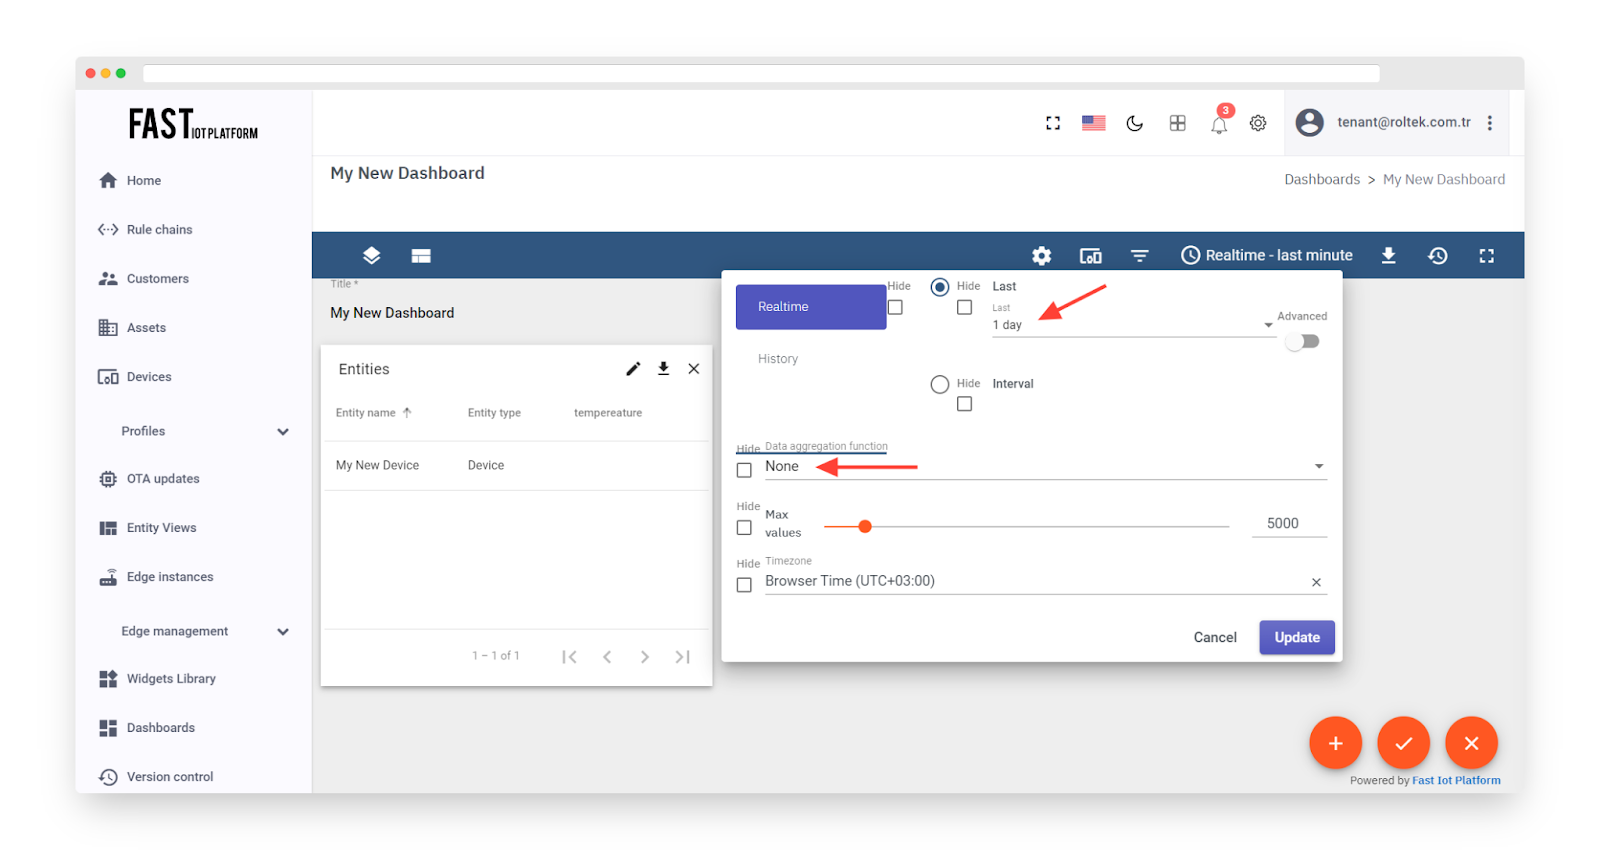
Fig. 3.4.8 – Modify the interval and aggregation function as desired. Update the time window and apply changes.
Well done! You have successfully incorporated a chart widget. Whenever you send fresh telemetry data, it will promptly reflect in the chart.
Step 3.5 Add Alarm Widget #
-
To initiate Edit mode, click on the corresponding button.
-
Then, go to the bottom right corner of the screen and click on the “Add new widget” icon.
-
Select the “Create new widget” icon.
-
Next, choose the “Alarm widgets” bundle and click on the header of the “Alarms table” widget.
-
Select “Entity” as the alarm source and “MyDevice” as the alias. Click on “Add”.
-
After that, find the newly created “Alarms” widget and move it to the top right corner of the dashboard by dragging and dropping it.
-
Finally, adjust the widget’s size and save the changes made.
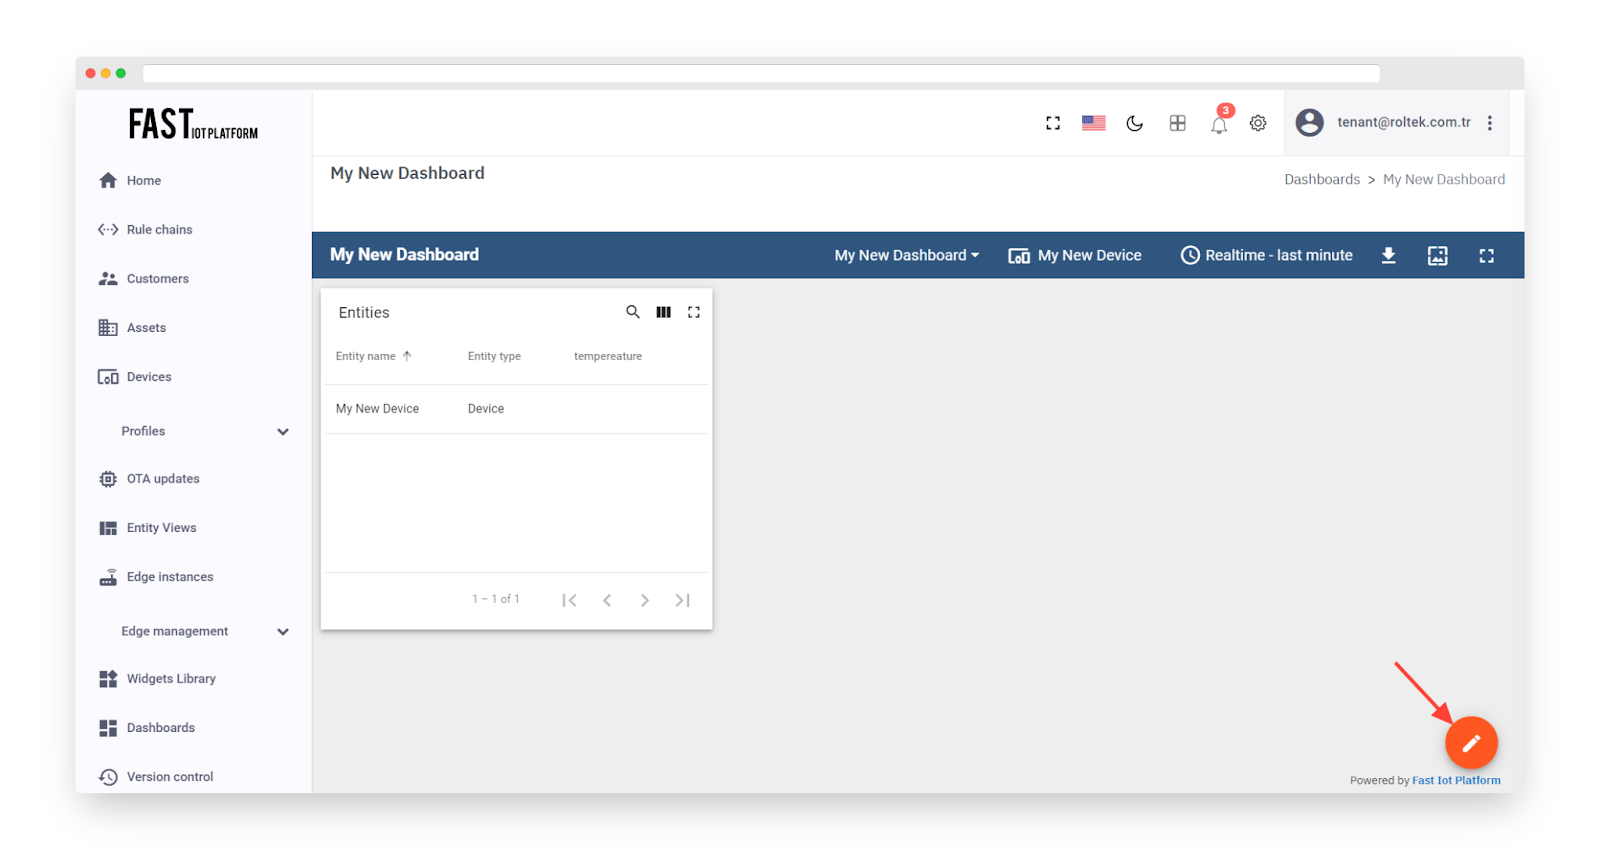
Fig. 3.5.1 – Enter edit mode.
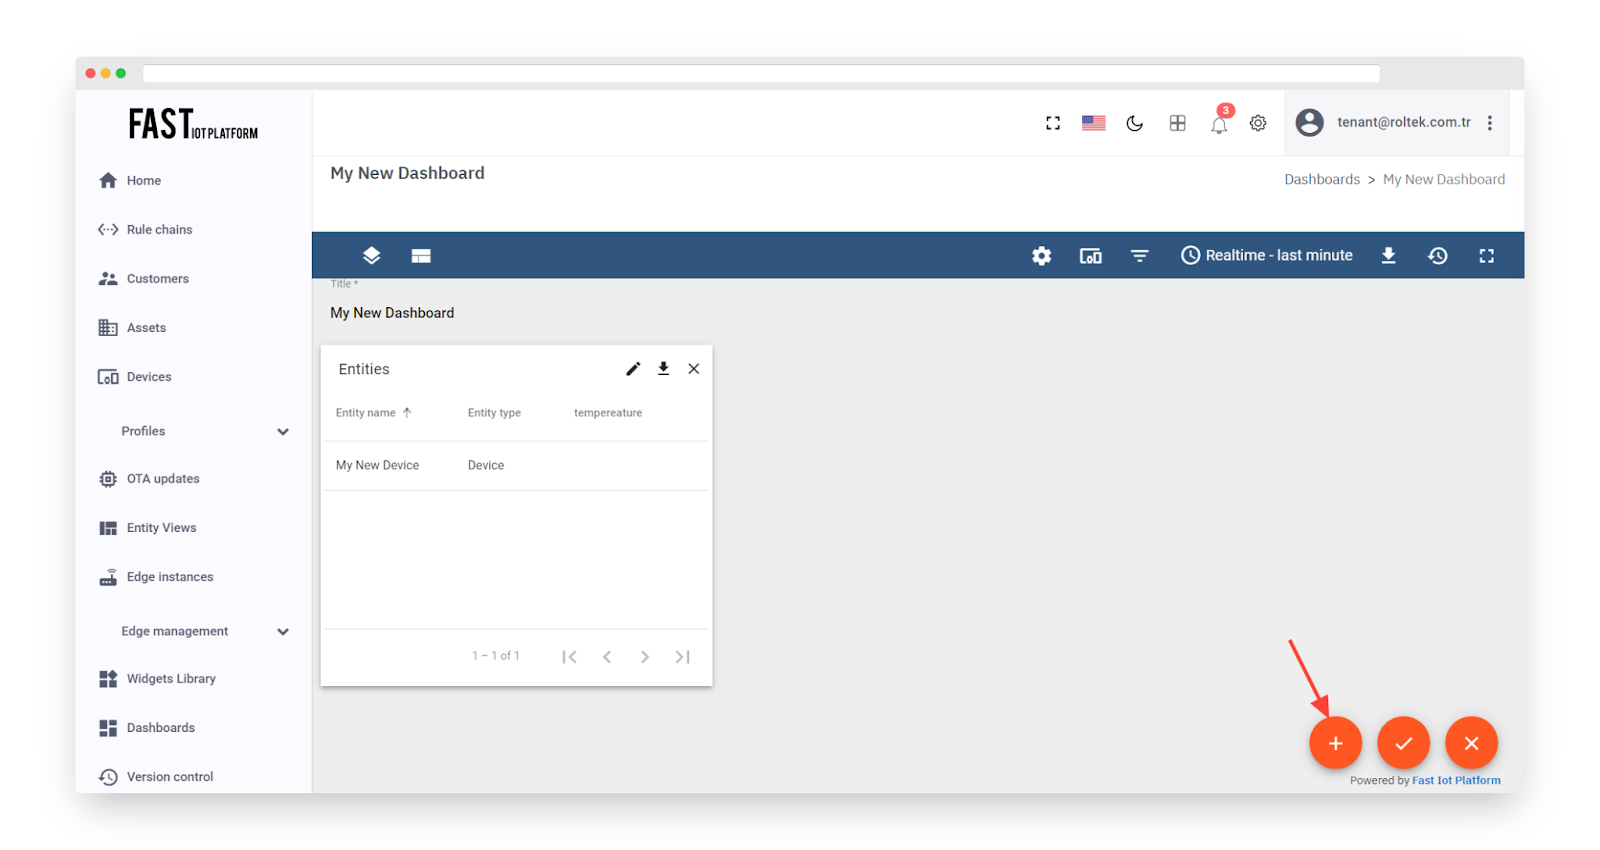
Fig. 3.5.2 – Click ‘+’ icon.
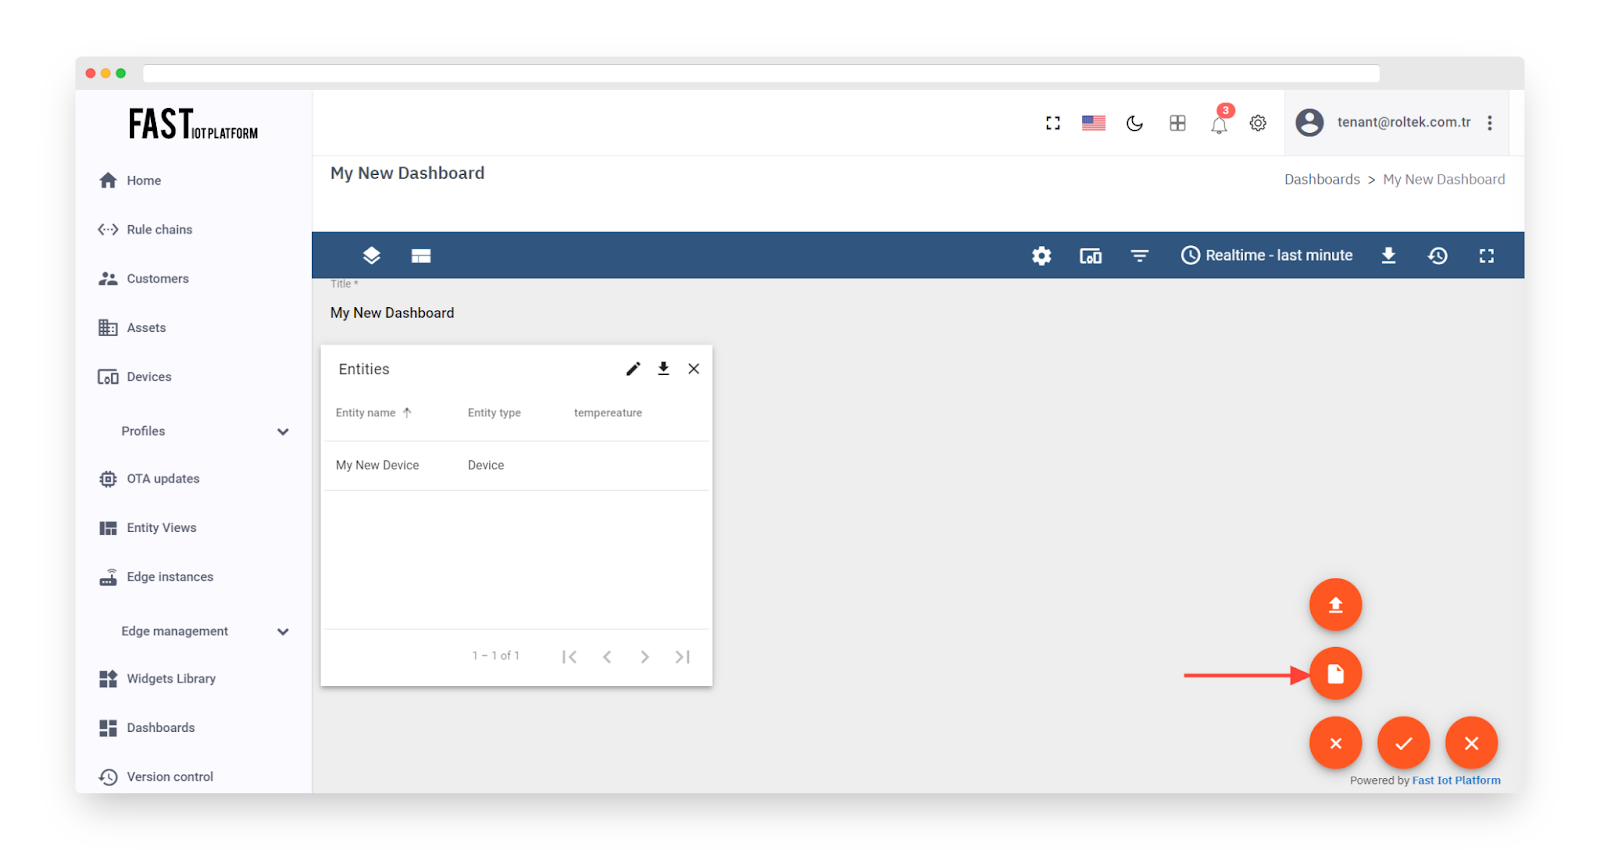
Fig. 3.5.3 – Click the “Create new widget” icon.
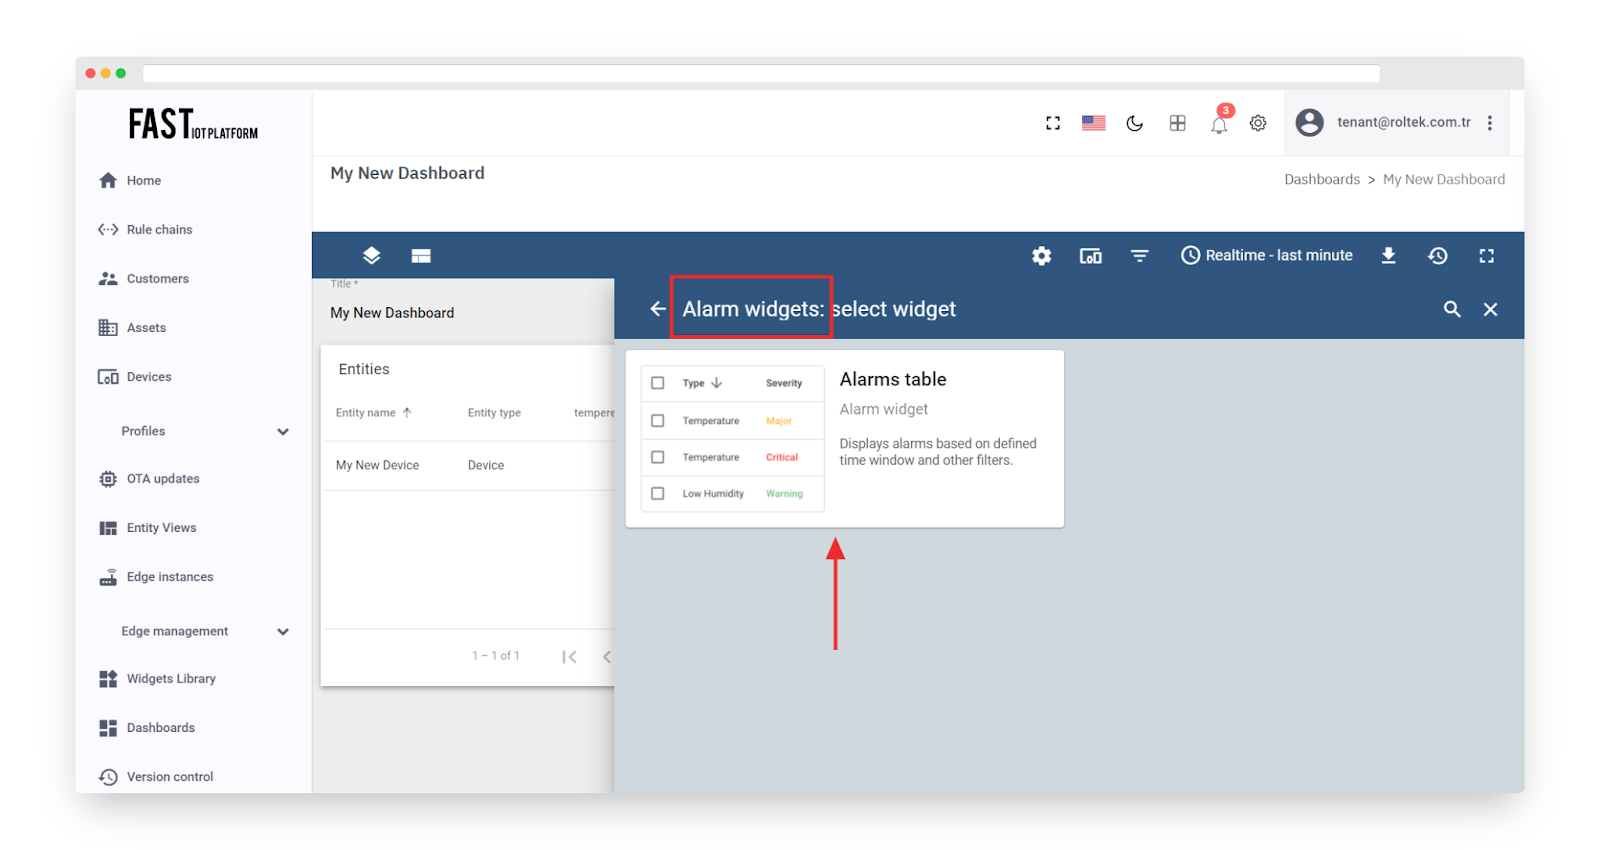
Fig. 3.5.4 – Choose the “Alarm widgets” bundle and click on the header of the “Alarms table” widget.
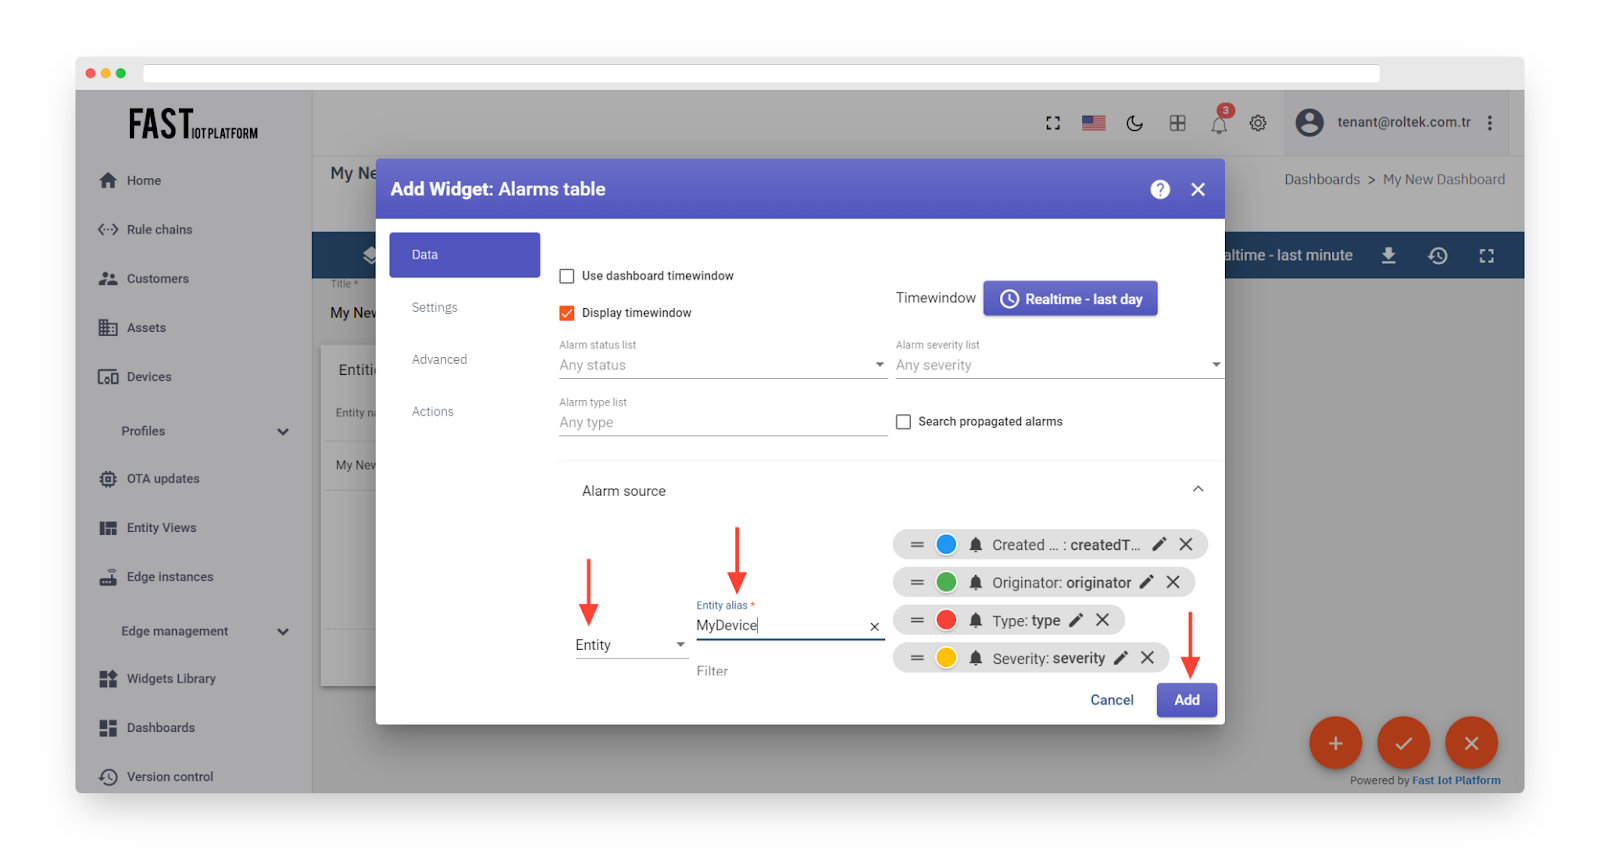
Fig. 3.5.5 – Select “Entity” as the alarm source and “MyDevice” as the alias. Click on “Add”.
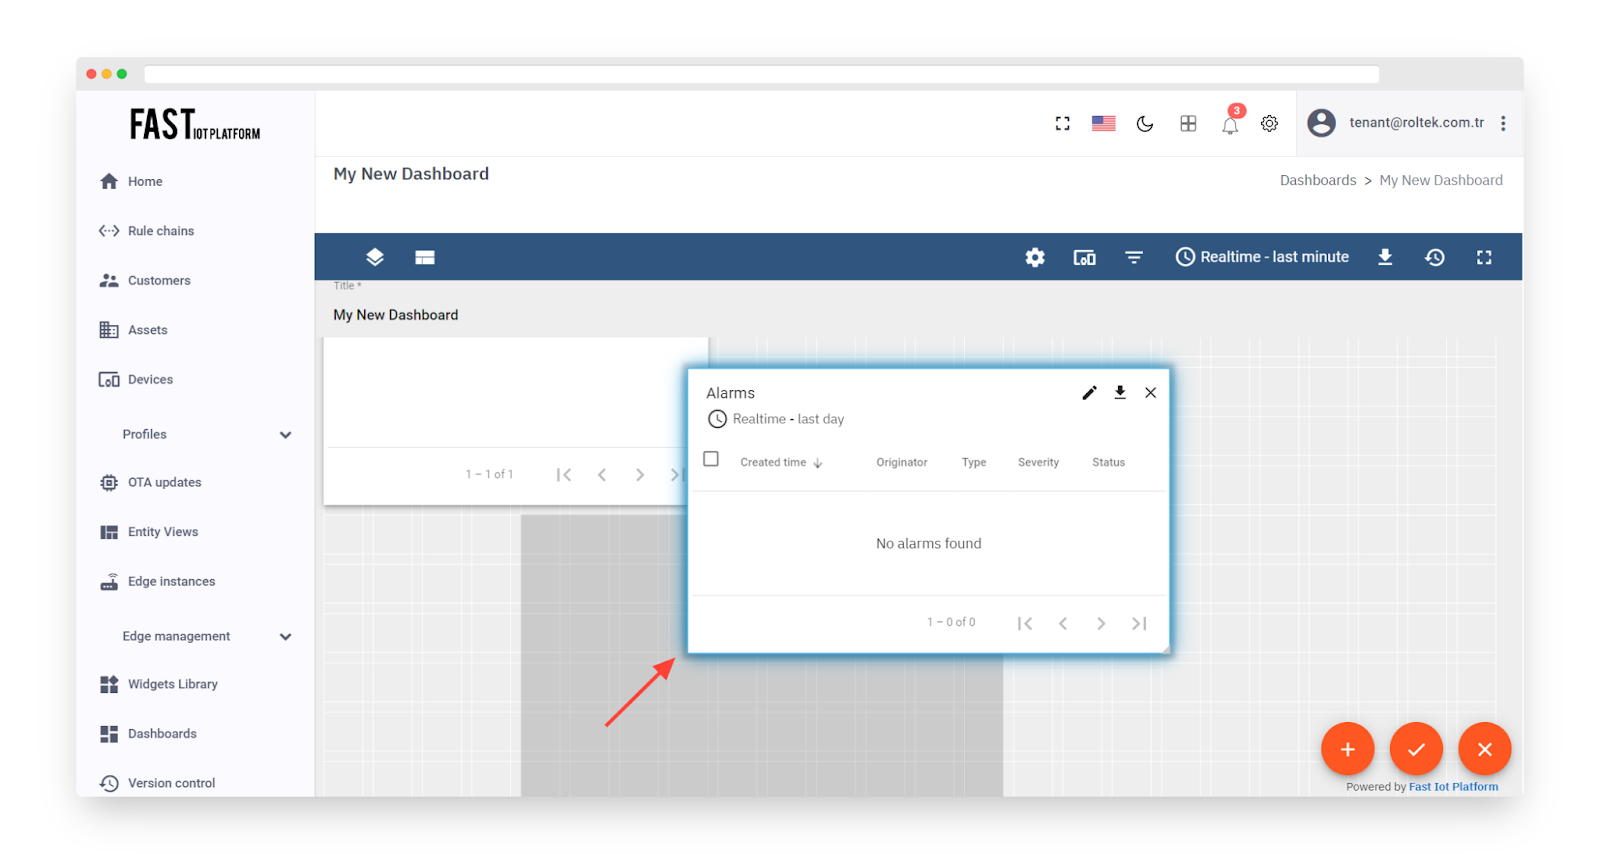
Fig. 3.5.6 – Scroll down and locate the new “Alarms” widget.
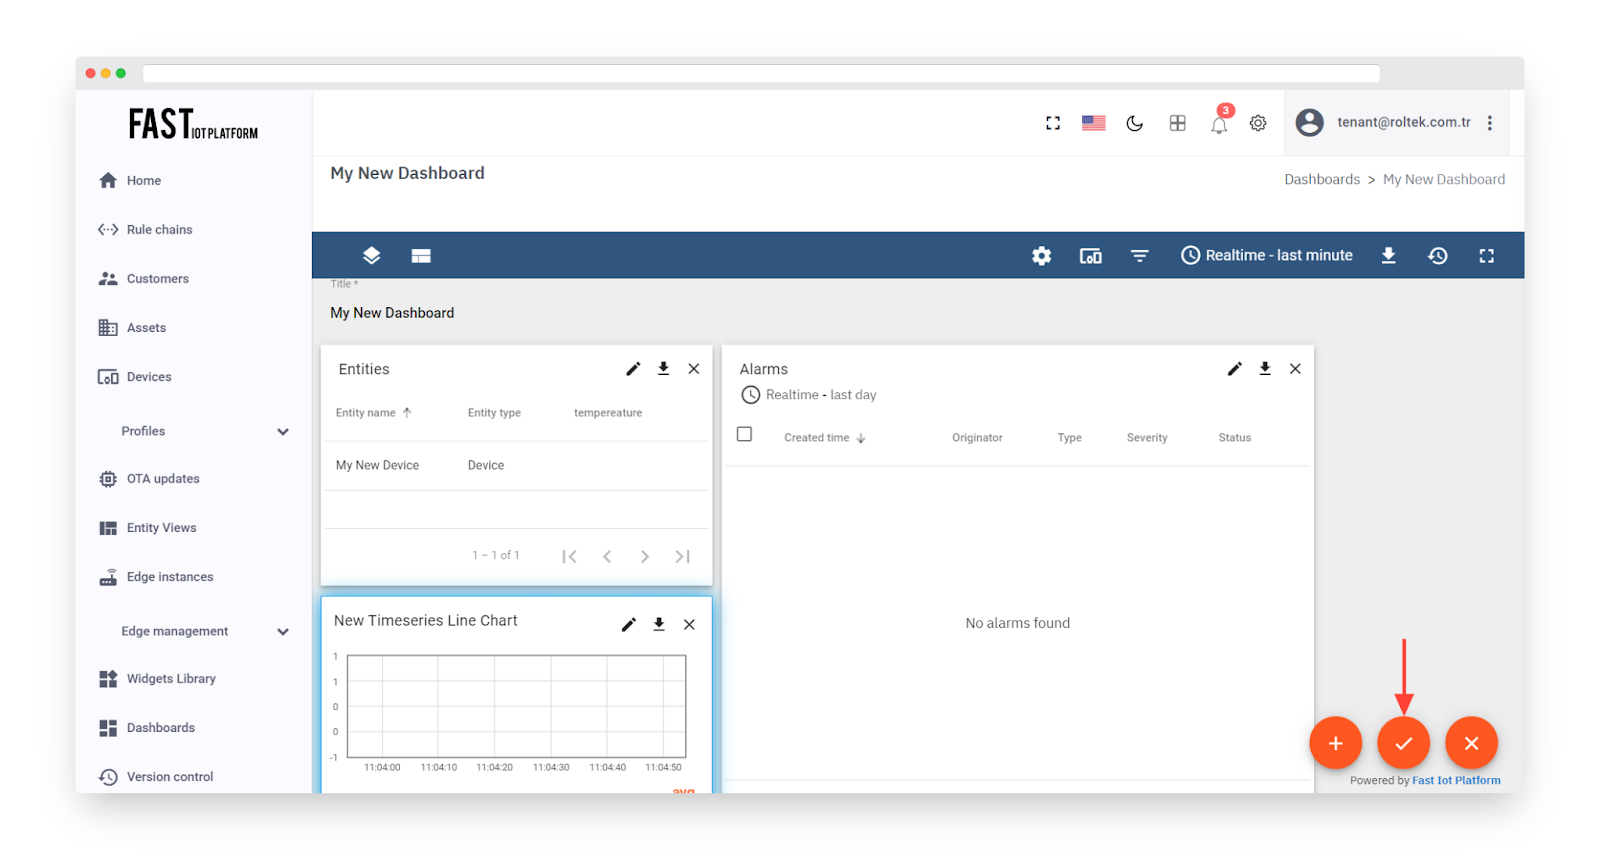
Fig. 3.5.7 – Resize the widget and apply changes.
Well done! You’ve successfully added an alarm widget. The next step is to set up some alarm rules and trigger some alarms.
Step 4. Configure Alarm Rules #
To trigger an alarm when the temperature reading goes above 25 degrees, we’ll utilize the alarm rules feature. To do so, we need to modify the device profile by adding a new alarm rule. The device “My New Device” is currently using the “Default” profile, although creating individual device profiles for each device type is recommended, we’ll skip this step for simplicity.
Here are the steps to follow:
-
Go to the device profiles page.
-
Click on the row corresponding to the default profile to open the profile details.
-
Select the “Alarm Rules” tab and toggle edit mode.
-
Click on “Add alarm rule”.
-
Specify the alarm type and click the “+” icon to add an alarm rule condition.
-
Click on the “Add key filter” button to specify a condition.
-
Select the key type, input the key name, select the value type, and click “Add”.
-
Choose the operation and input the threshold value, then click “Add”.
-
Click “Save”.
-
Finally, click “Apply changes”.
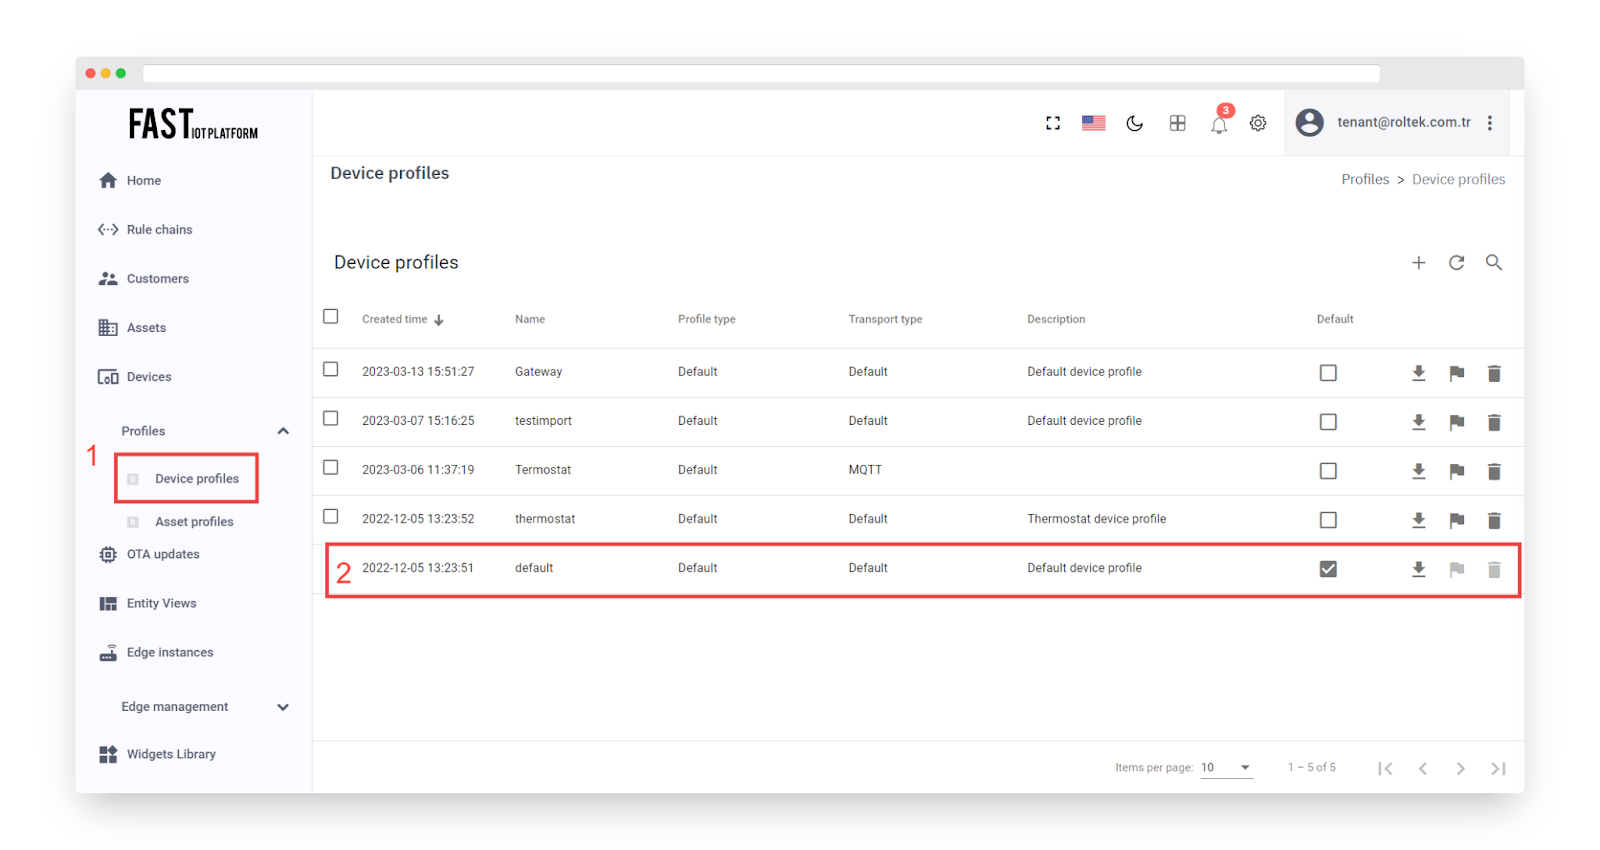
Fig. 4.1 – Click the default profile row.
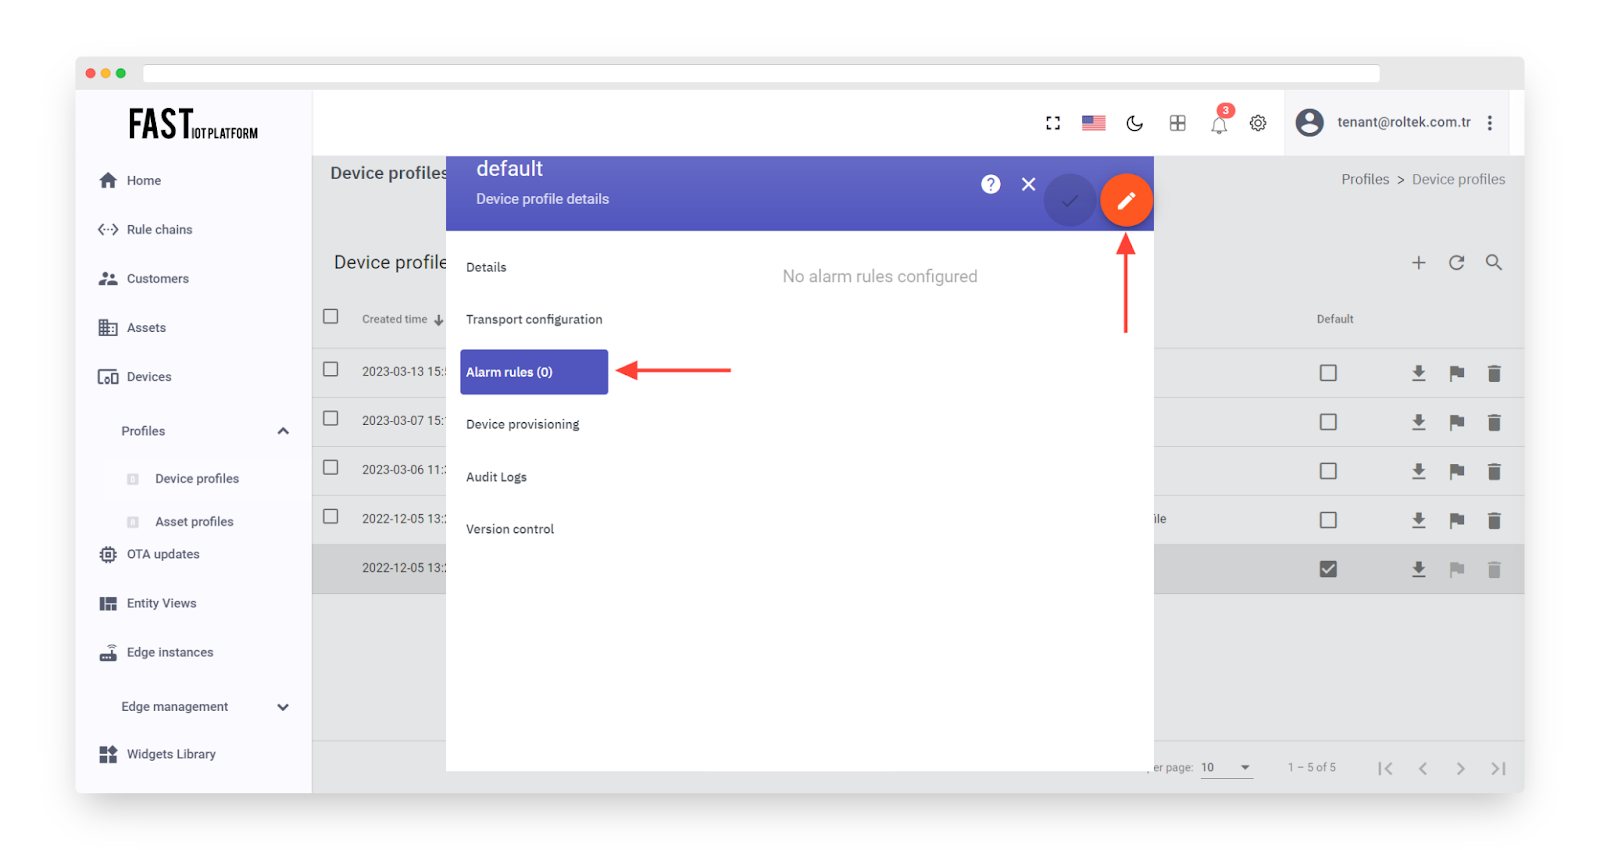
Fig. 4.2 – Select the “Alarm Rules” tab and toggle edit mode.
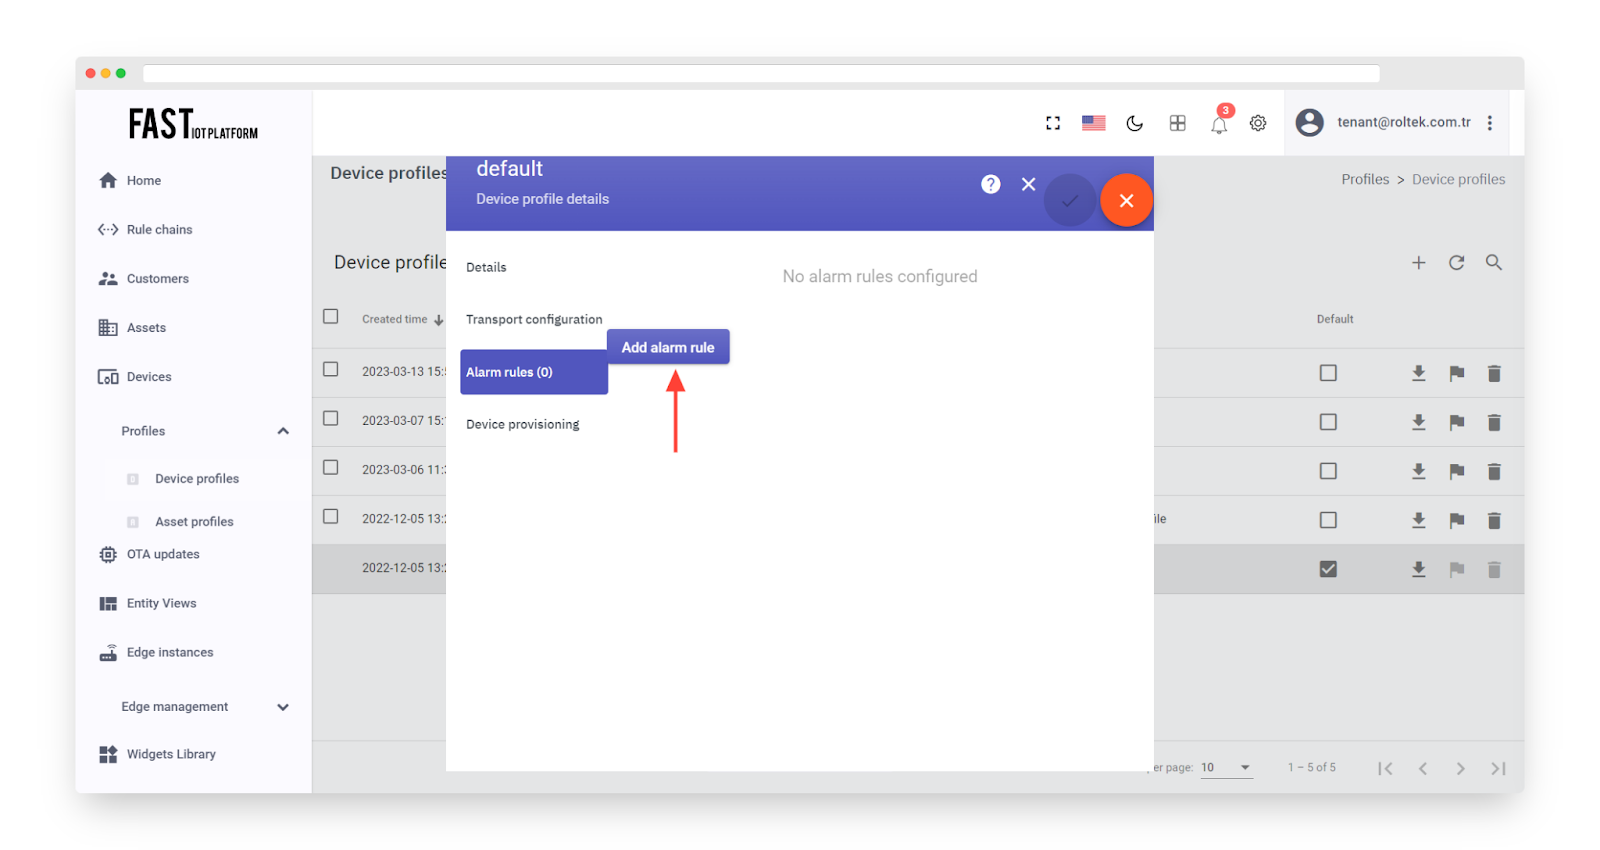
Fig. 4.3 – Click on “Add alarm rule”.
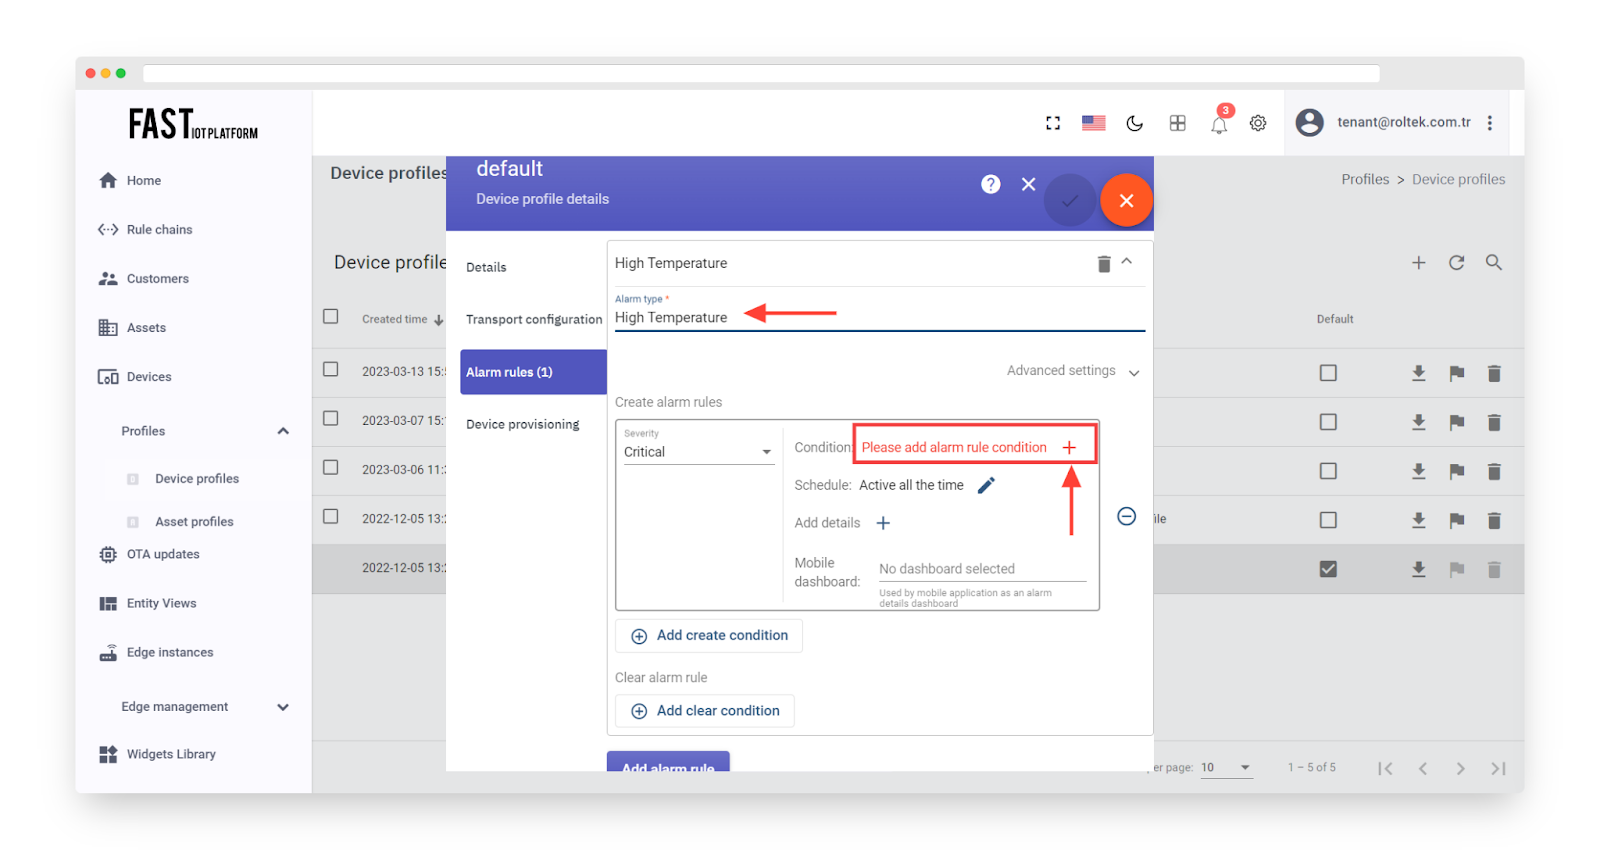
Fig. 4.4 – Specify the alarm type and click the “+” icon to add an alarm rule condition.
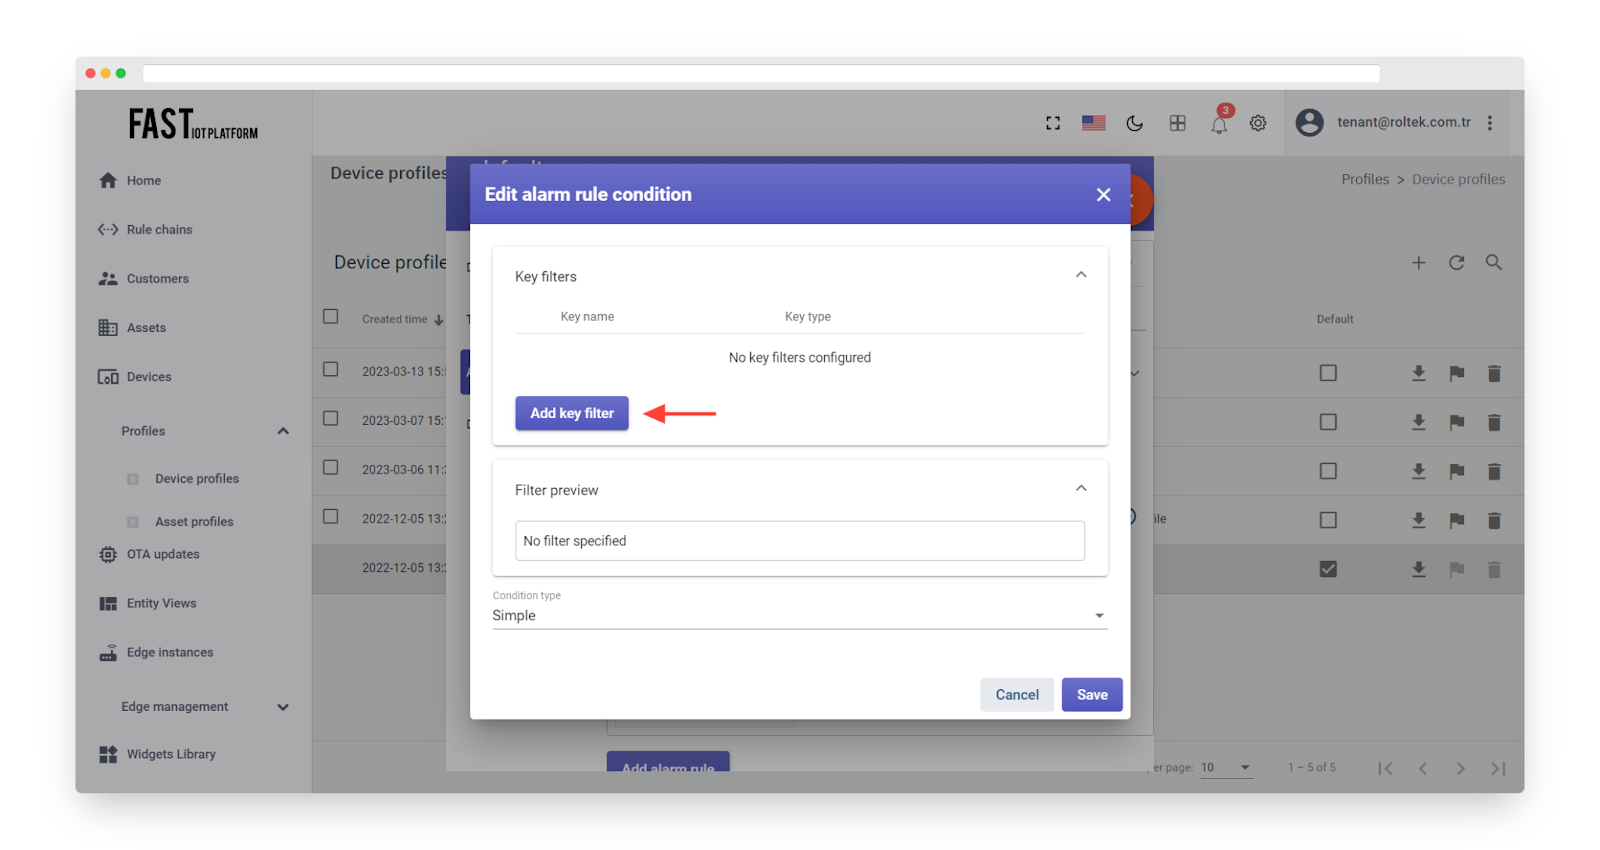
Fig. 4.5 – Click on the “Add key filter” button.
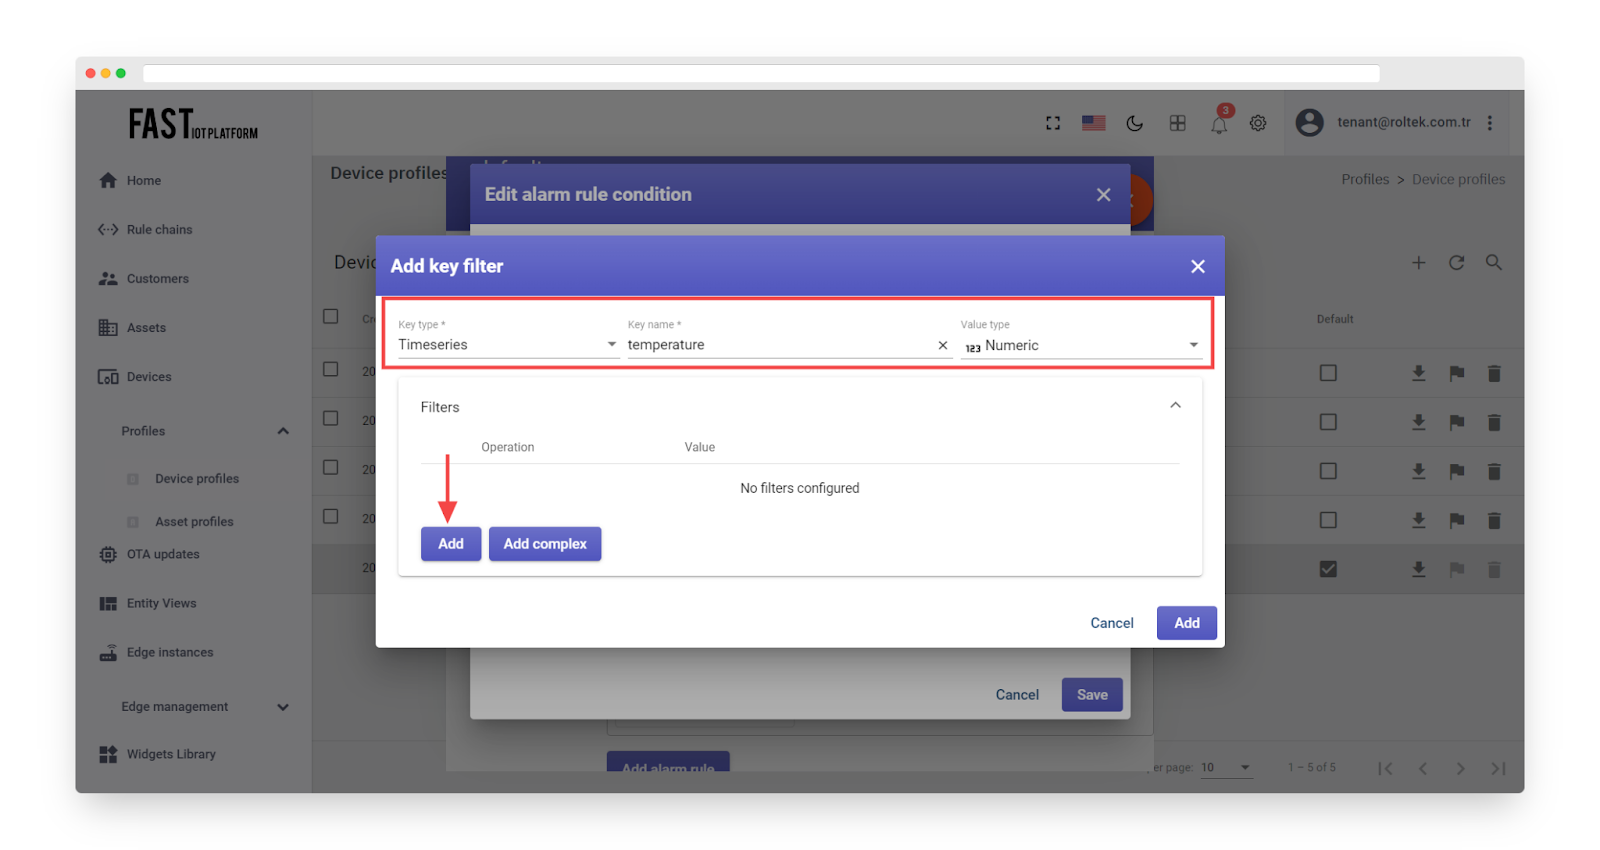
Fig. 4.6 – Select the key type, input the key name, select the value type, and click “Add”.
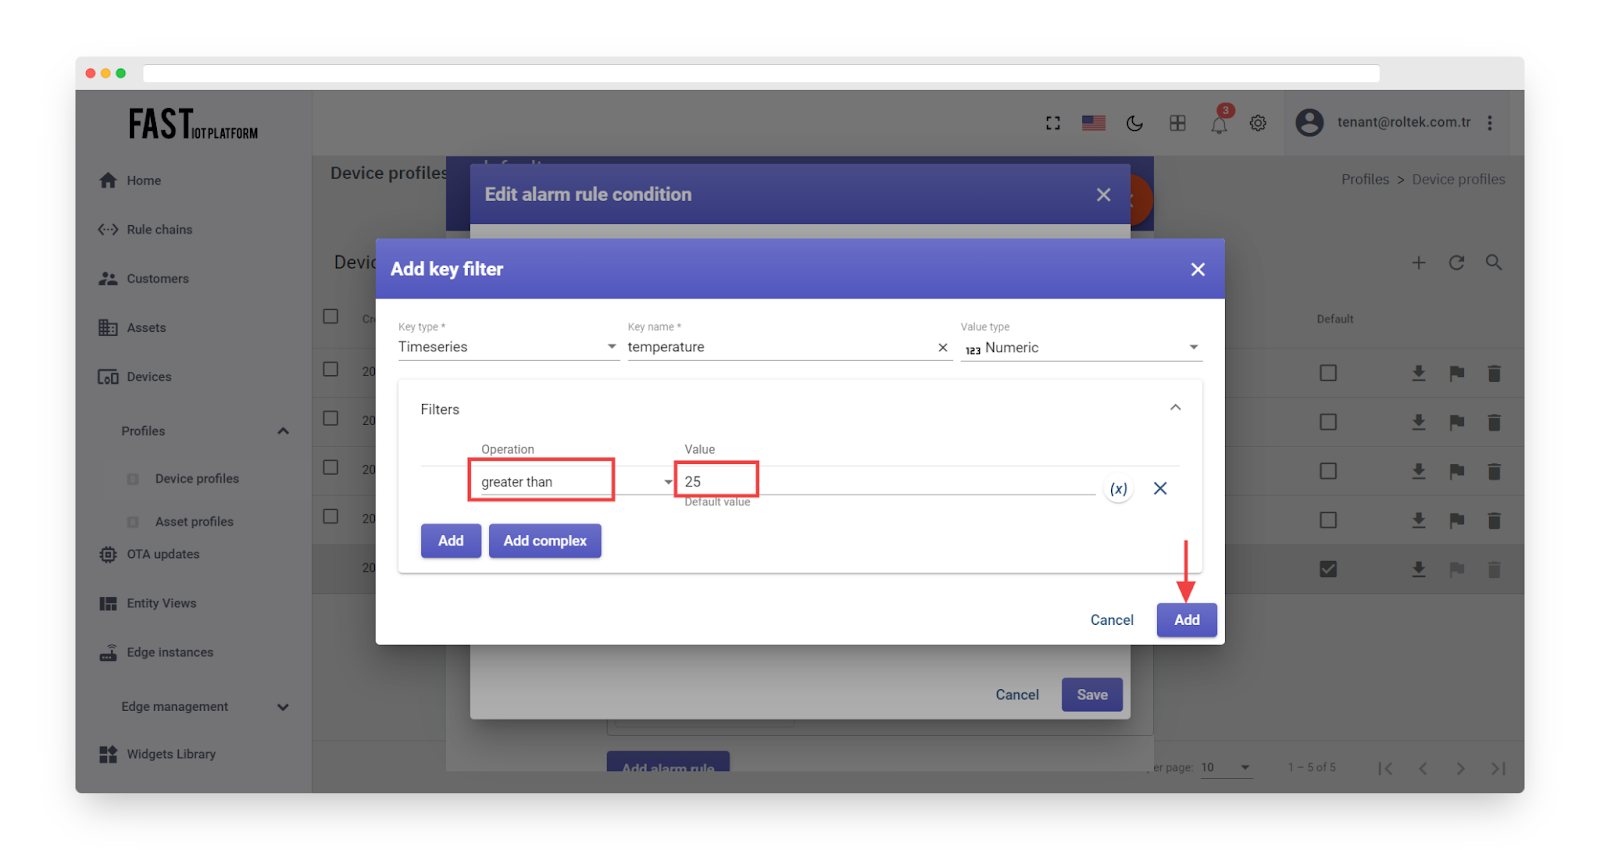
Fig. 4.7 – Choose the operation and input the threshold value, then click “Add”.
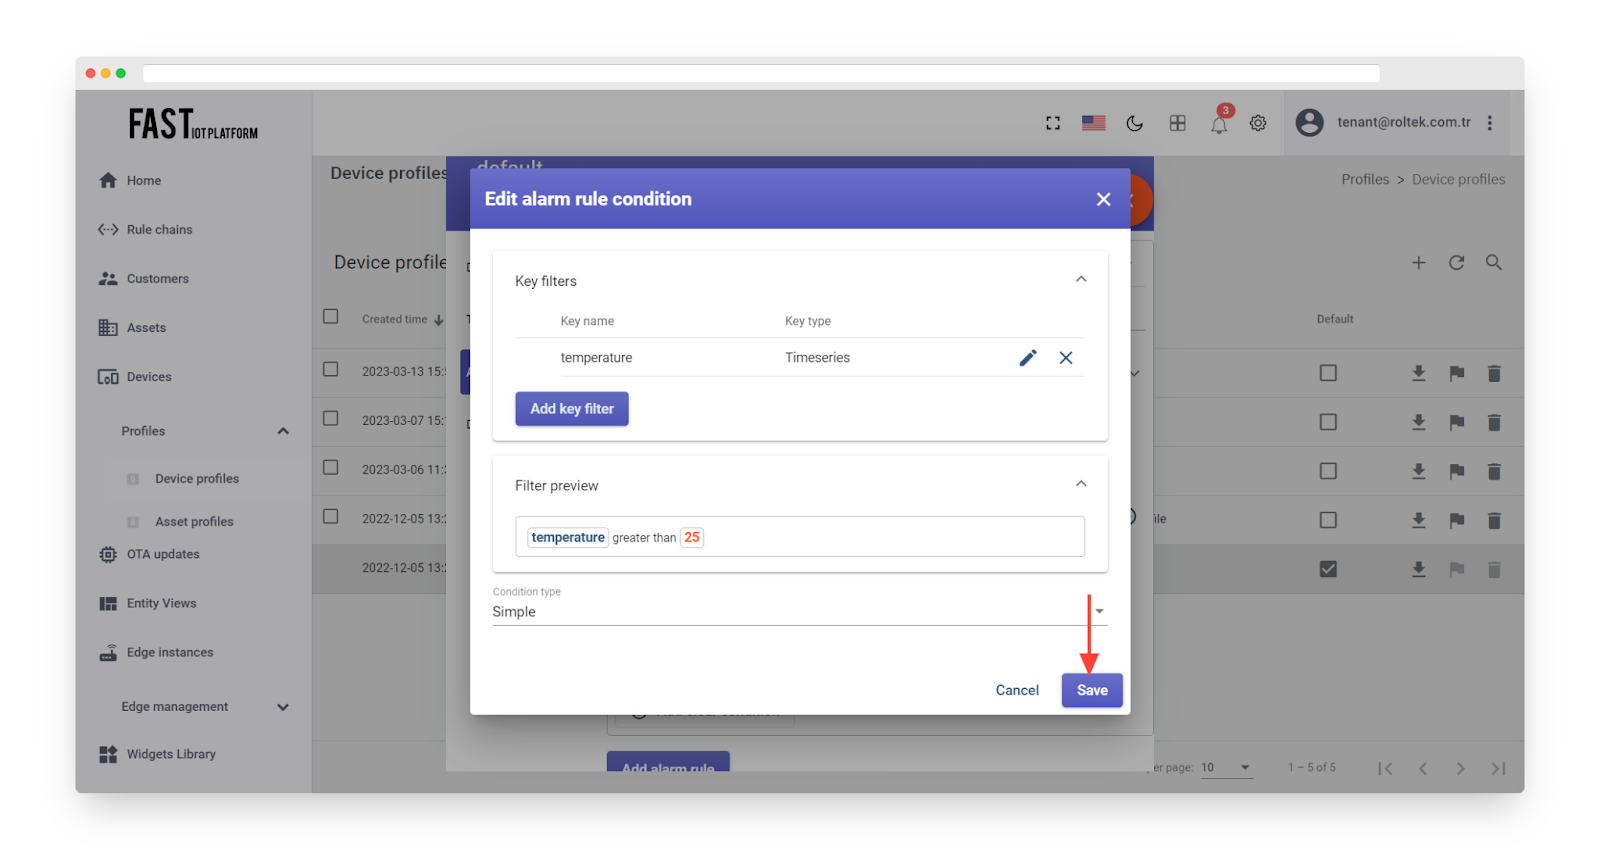
Fig. 4.8 – Click “Save”.
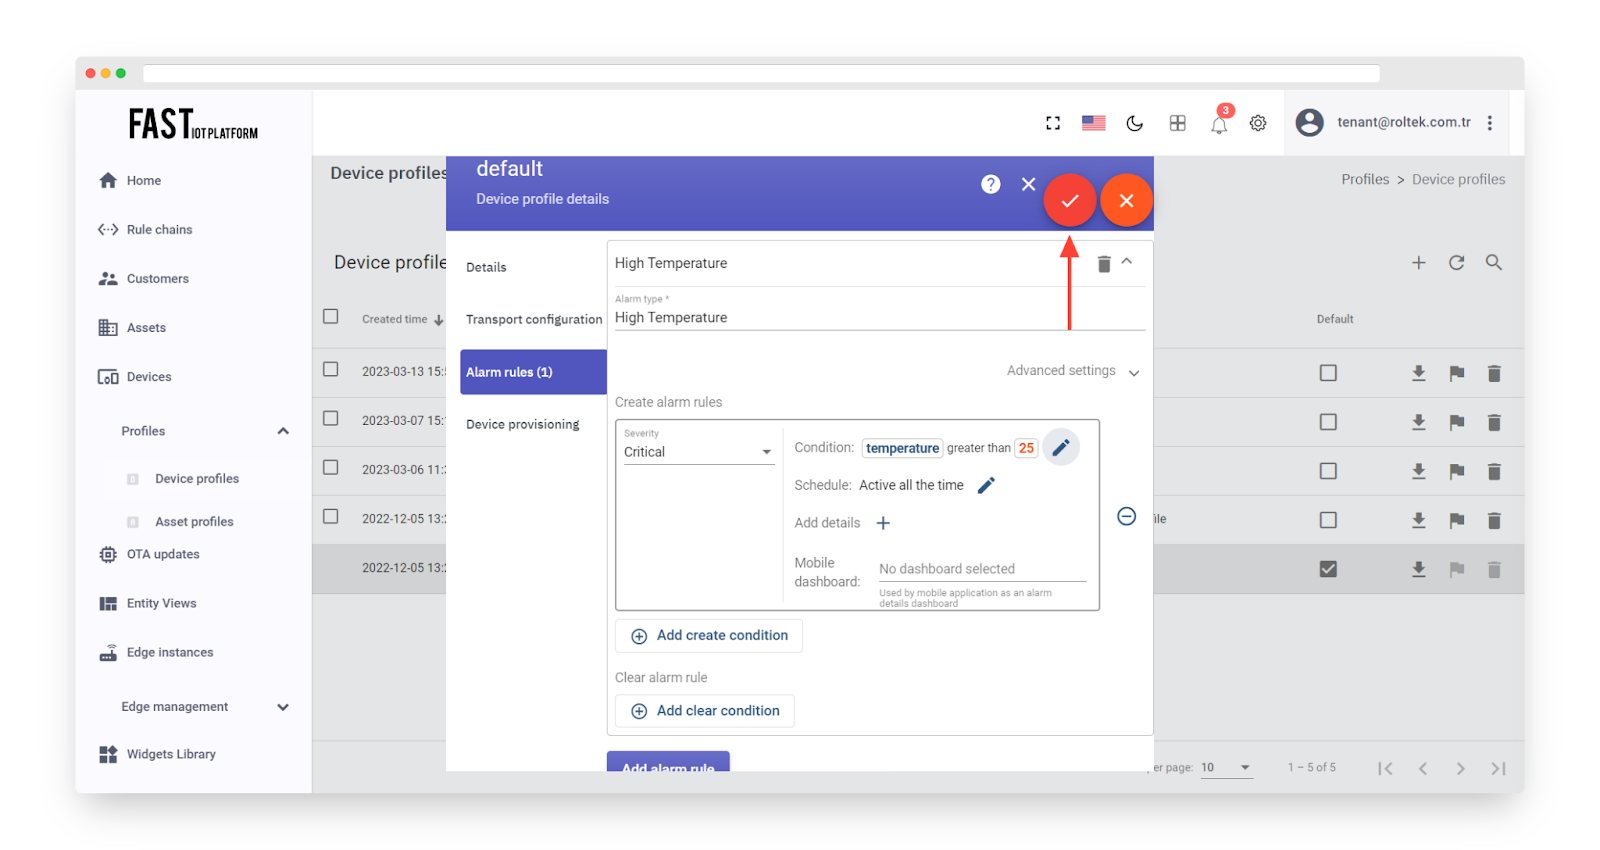
Fig. 4.9 – Click “Apply changes”.
Step 5. Create Alarm #
After activating the alarm rule (as outlined in Step 4), it is necessary to send new telemetry on behalf of the device (as explained in Step 2) in order to trigger the alarm. It’s important to note that the temperature value needs to be 26 or higher in order to raise the alarm. Once the new temperature reading is sent, a new alarm should appear on the dashboard right away.
-
It’s worth noting that the new temperature telemetry will result in a fresh active alarm being generated. As a user, it is possible to acknowledge and clear the alarms.
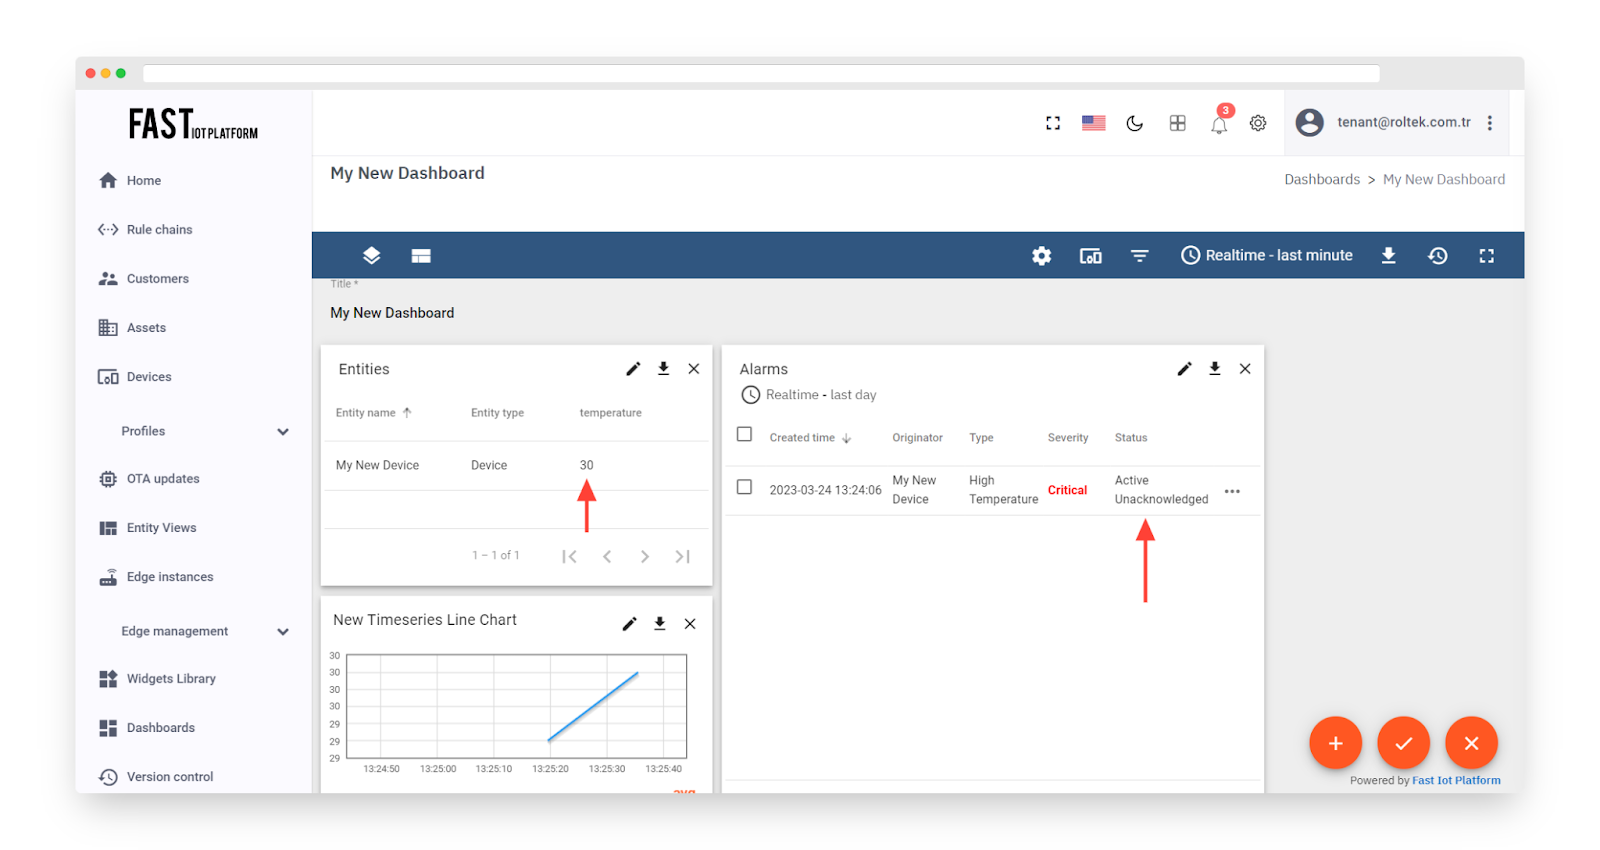
Fig. 5.1 – Observe that the recent temperature readings are leading to the triggering of a fresh active alarm.
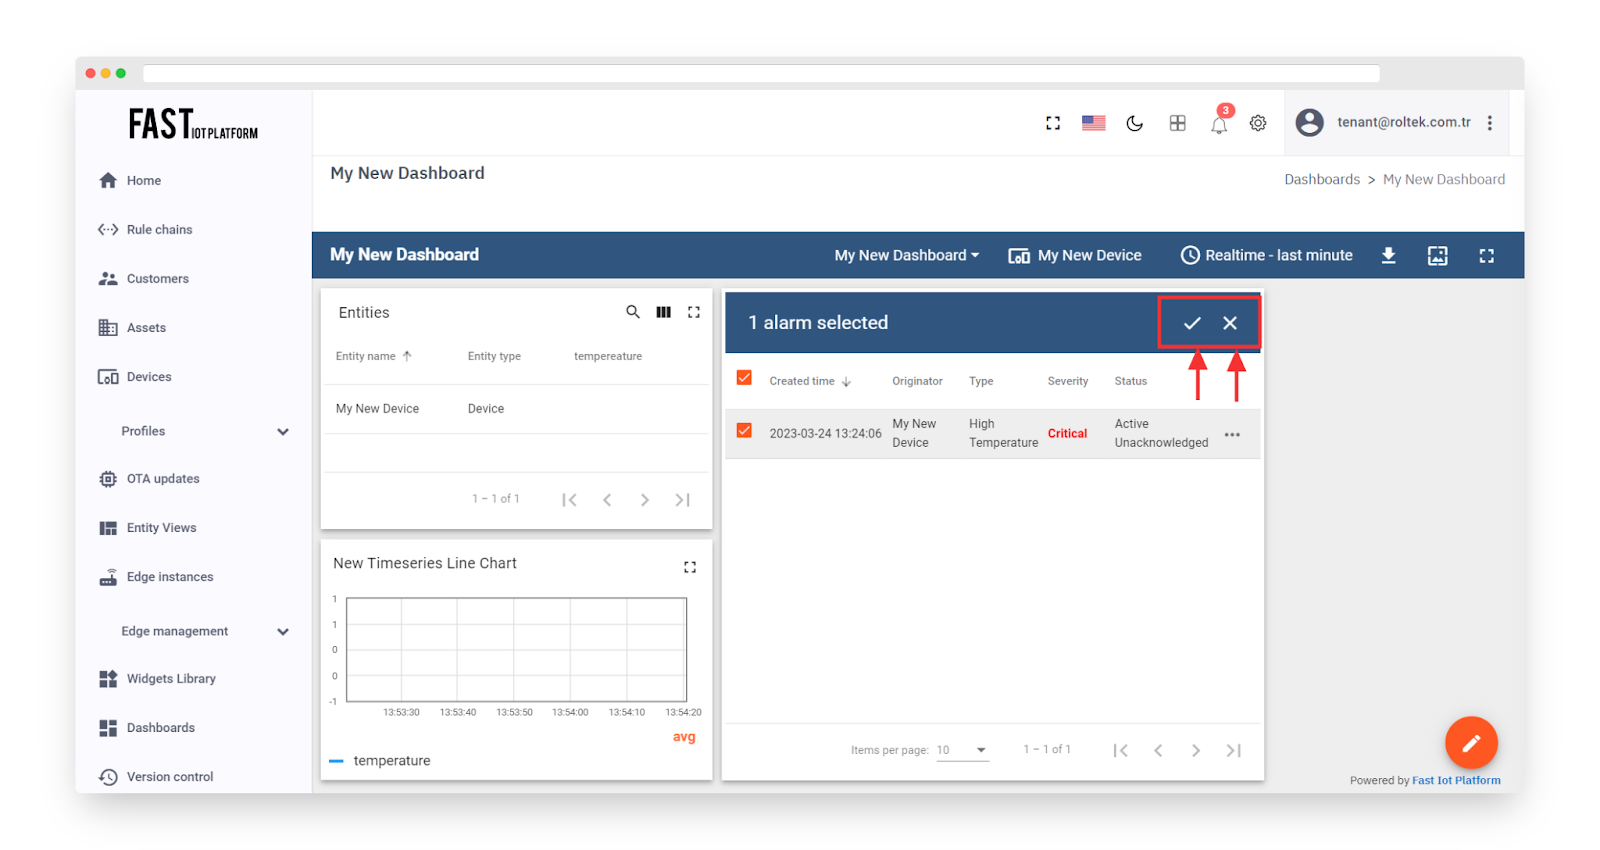
Fig. 5.2 – The individual utilizing the system has the option to acknowledge and dismiss the alarms.
Step 6. Alarm notifications #
Setting up email or SMS notifications for alarms is a straightforward process. We suggest examining the provided examples of alarm rules and perusing the documentation related to alarm notifications.
Please take note that ThingsBoard presently facilitates the utilization of AWS SNS and Twilio for sending SMS notifications, both of which require the creation of an account and are not free of charge. Nonetheless, you can integrate with other SMS/EMAIL gateways through the REST API call node.
Step 7. Assign Device and Dashboard to Customer #
One of the key functionalities provided by ThingsBoard is the ability to allocate Dashboards to Customers. This enables the segregation of various devices to different customers. Furthermore, you have the flexibility to generate one or more Dashboards and assign them to multiple customers. Consequently, each user belonging to a specific customer will only be able to view the devices associated with their account, and won’t be granted access to any data or devices belonging to other customers.
Step 7.1 Create customer #
We can generate a new customer titled “My New Customer” by following the instructions outlined below:
-
Proceed to the Customers page.
-
Select the “+” symbol to initiate the addition of a new customer.
-
Enter the desired title for the customer and click on the “Add” button to complete the process.
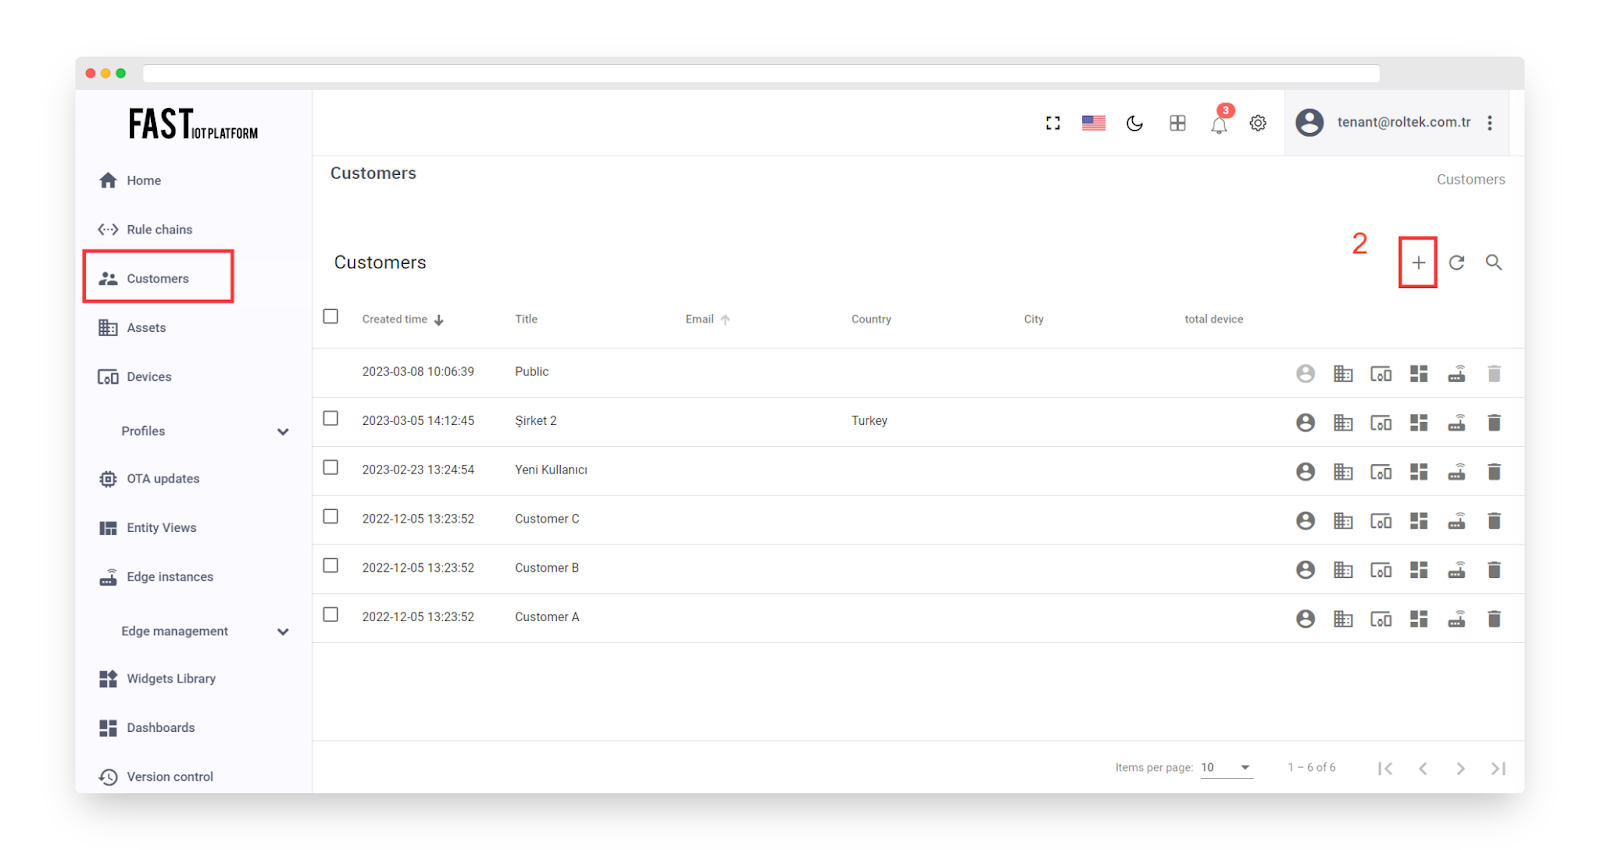
Fig. 7.1.1 – To create a new customer, go to the Customers page and click on the symbol “+” to initiate the process.
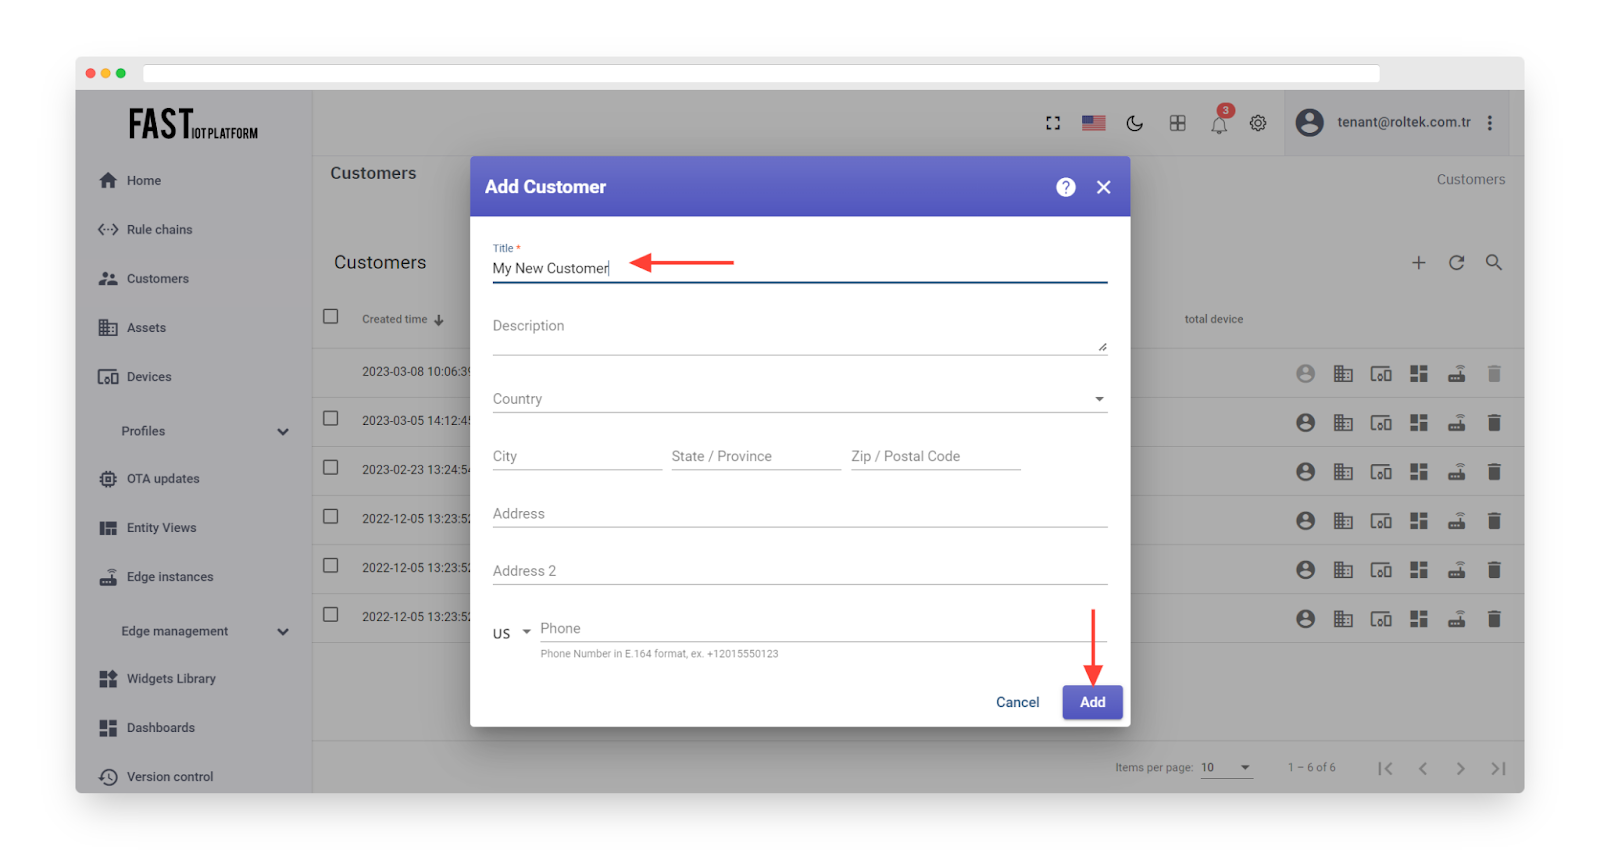
Fig. 7.1.2 – Add customer title and click “Add”.
Step 7.2 Assign device to Customer #
We can allocate a device to the newly created customer by completing the steps below:
-
Navigate to the Devices page.
-
Click on “Assign to customer” for the device “My New Device”.
-
Choose “My New Customer” from the available options and click on “Assign”. This will enable the customer’s users to view and modify the device’s telemetry, as well as send commands to it.
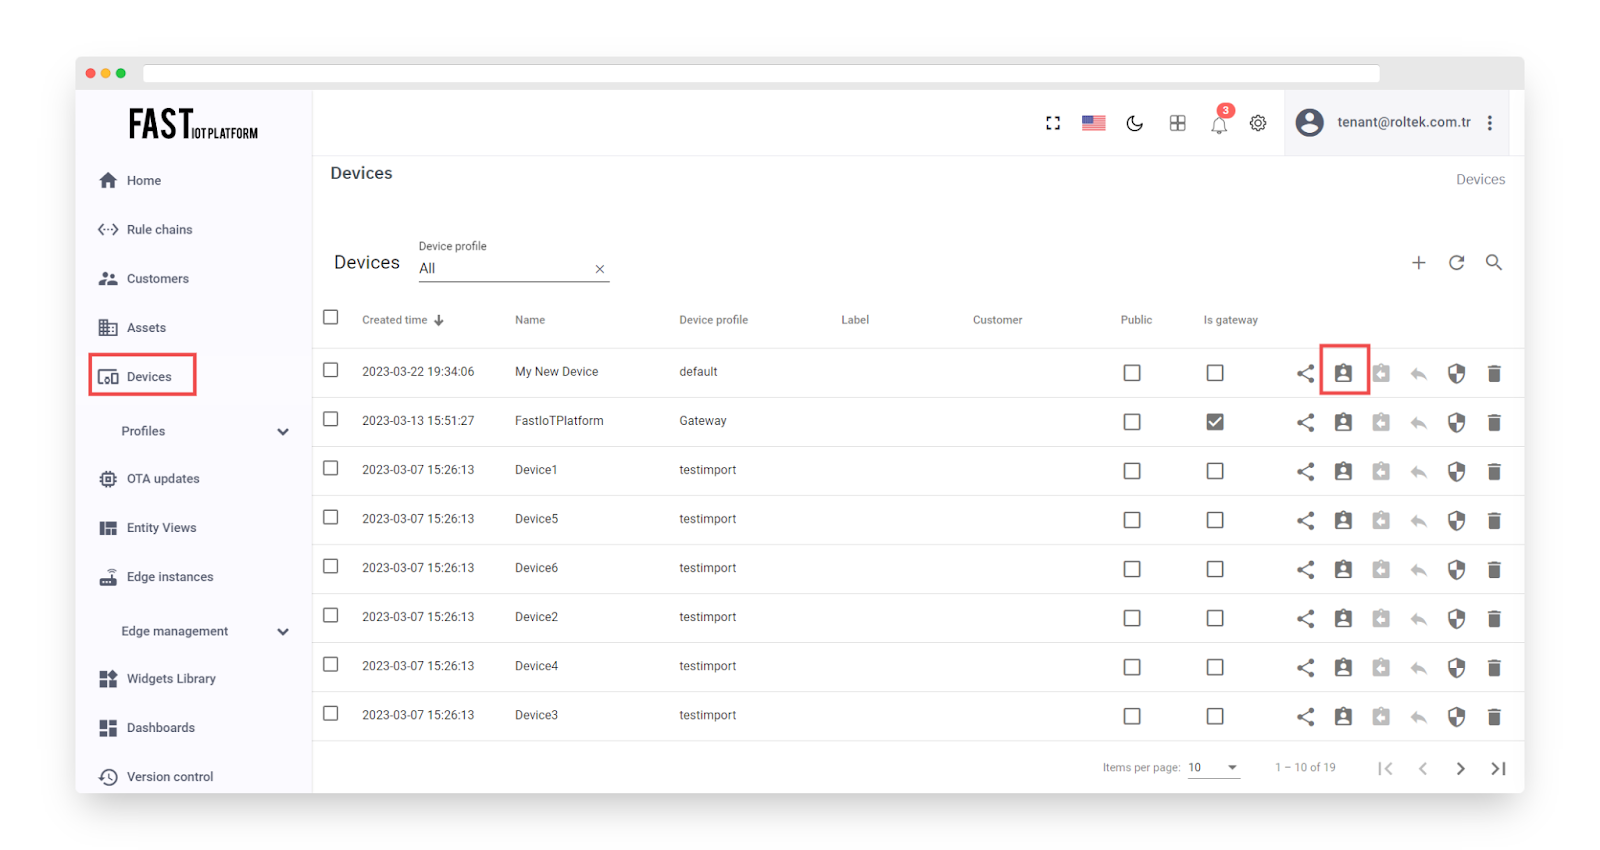
Fig. 7.2.1 – Open Devices page and click “Assign to customer” for “My New Device”.
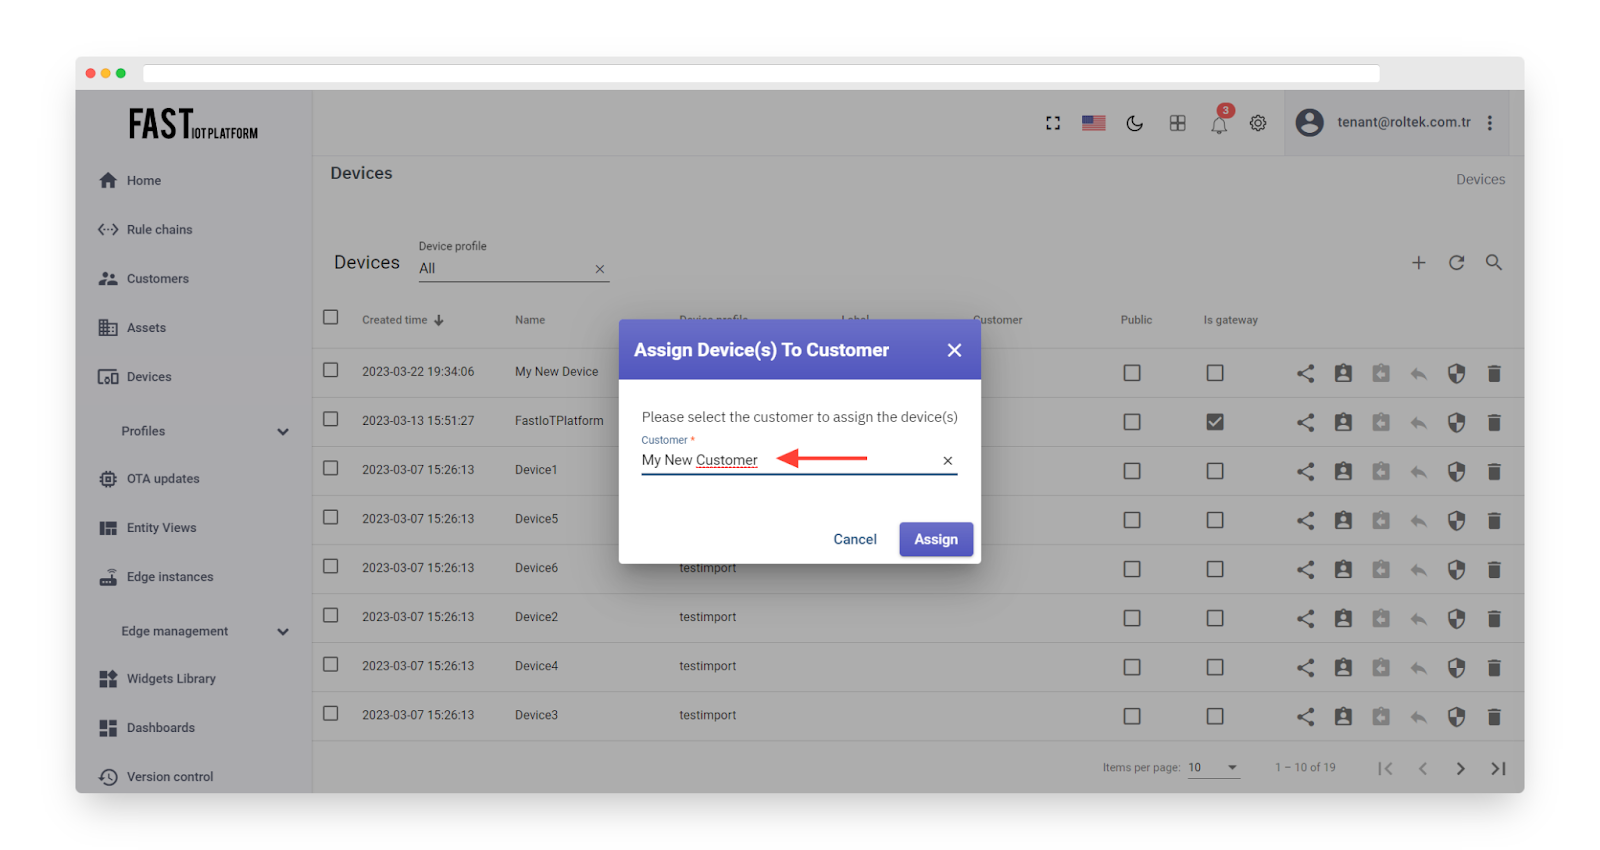
Fig. 7.2.2 – Select “My New Customer” and click “Assign”.
Step 7.3 Assign dashboard to Customer #
To share a dashboard with the newly created customer, please follow the instructions given below:
-
Open the Dashboards page.
-
Click on “Manage assigned customers”.
-
Select “My New Customer” from the list of available customers.
-
Click on “Update”. This will provide read-only access to the Dashboard for the customer’s users.
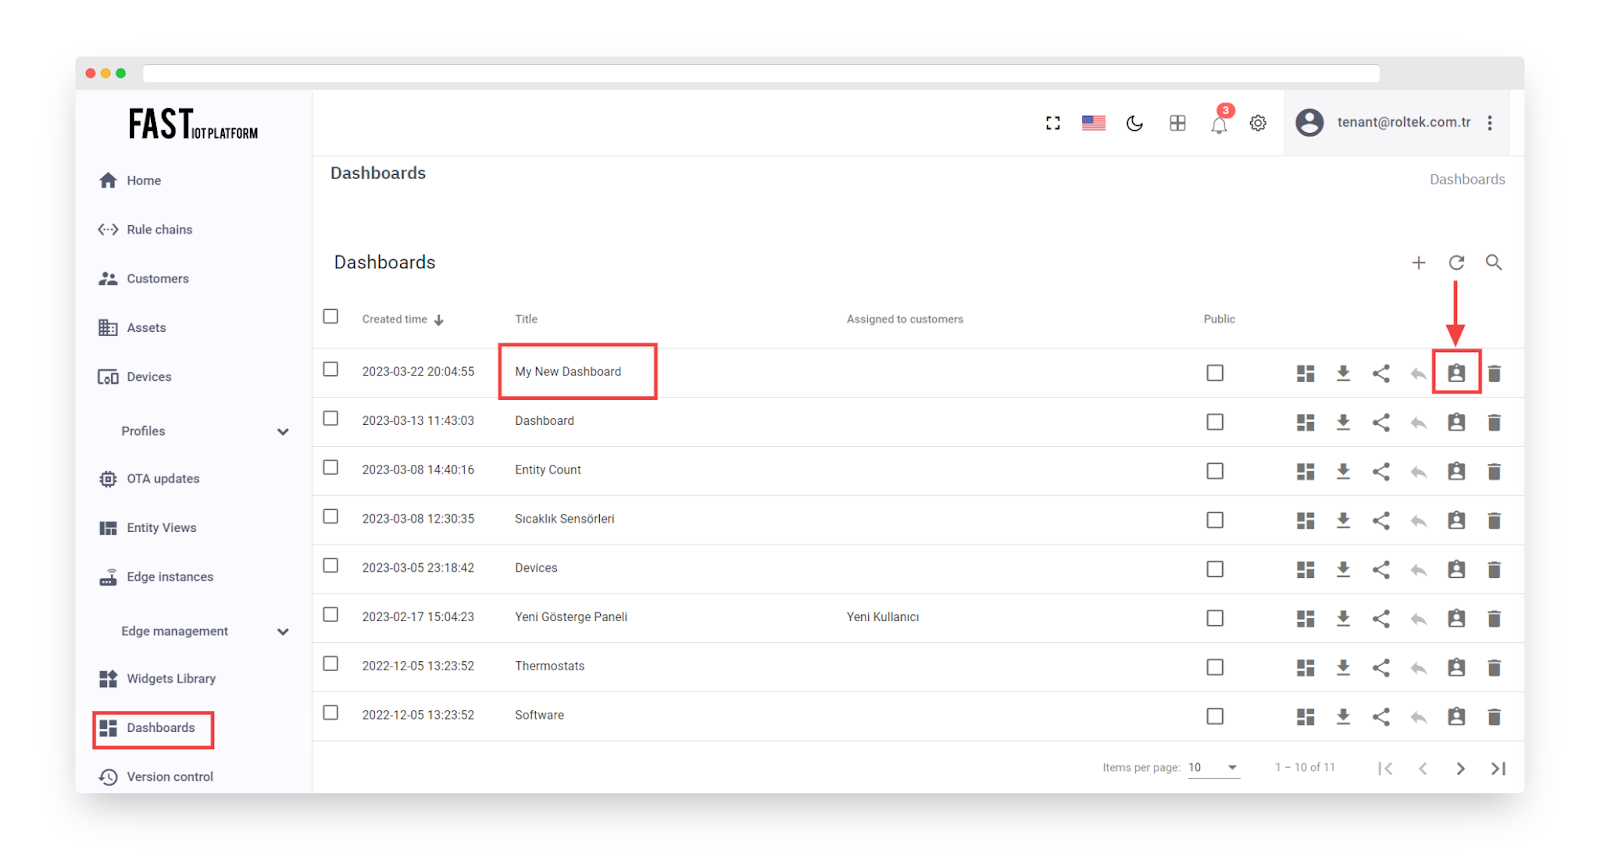
Fig. 7.3.1 – Open Dashboards and click “Manage assigned customers”.
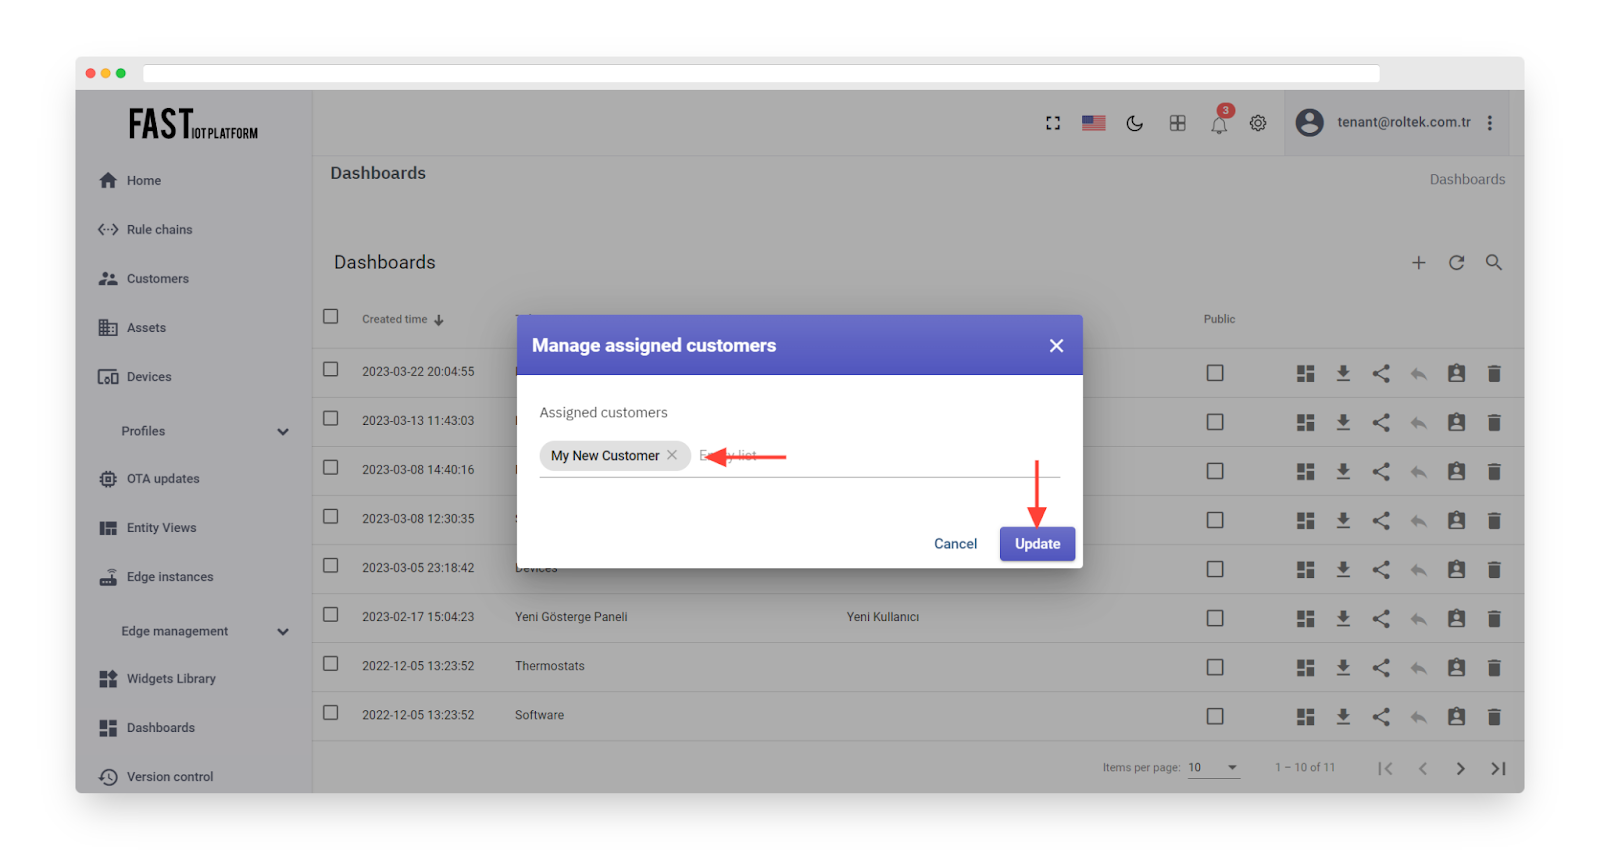
Fig. 7.3.2 – Select “My New Customer” and click “Update”.
Step 7.4 Create customer user #
To create a user who belongs to the customer and only has read-only access to the dashboard and device, follow these steps:
-
Go to the “Customers” page and click the “manage customer users” icon.
-
Click the “Add user” icon.
-
Enter the email address that you will use to log in as a customer user and click “Add”.
-
Copy the activation link and save it in a secure location. You will need it later to set the password.
-
Open the user details.
-
Toggle the edit mode.
-
Select the default dashboard and check the “Always fullscreen” option.
-
Apply the changes.
-
Additionally, if you want the dashboard to appear immediately after the user logs in to the platform web UI, you can configure it accordingly.
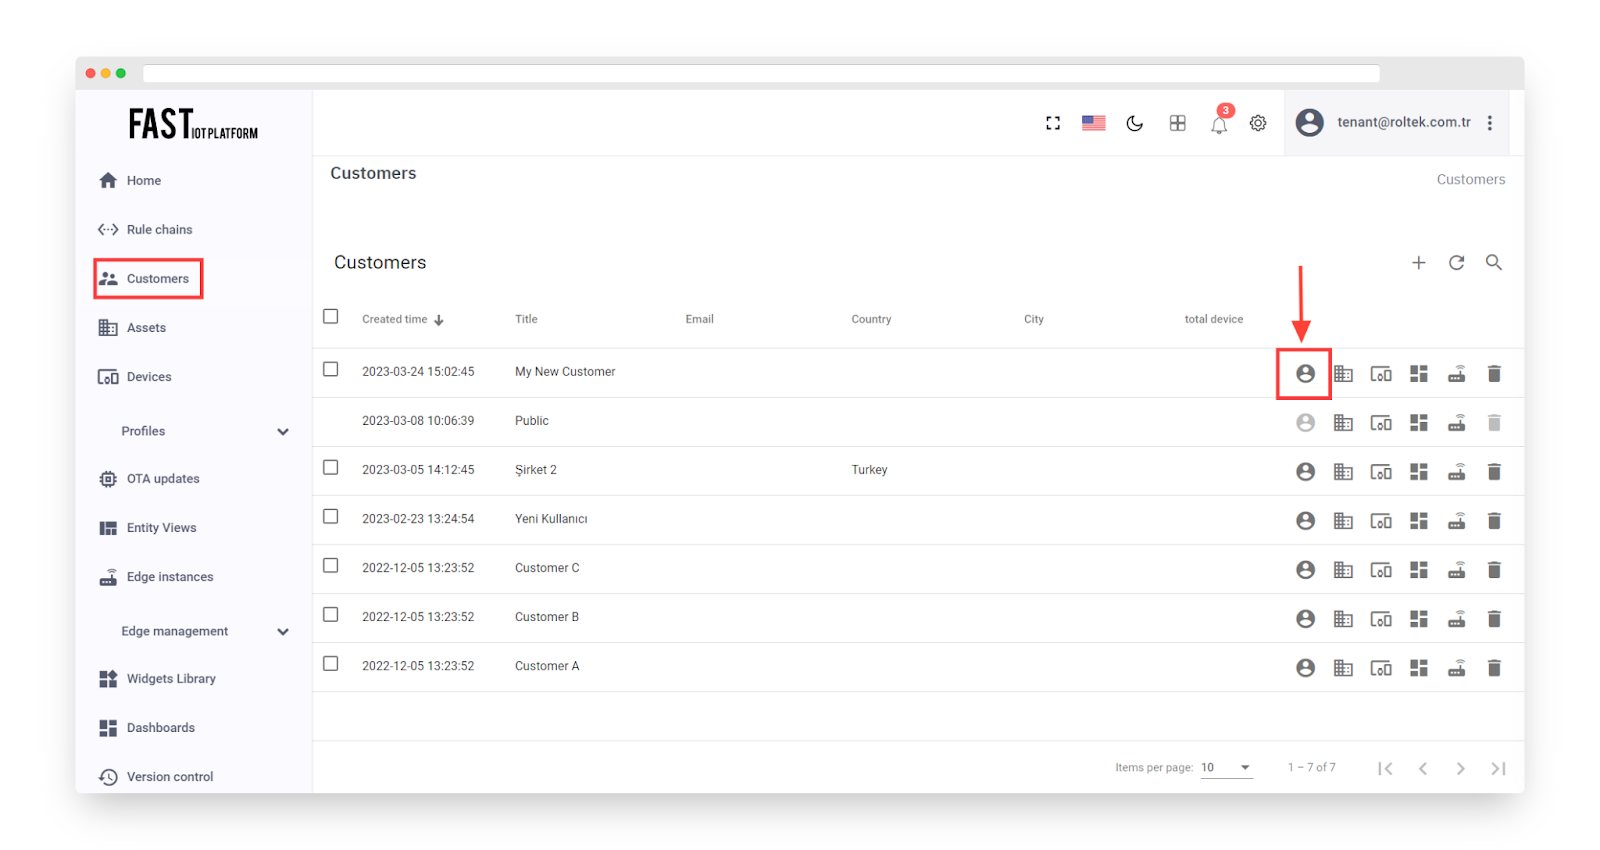
Fig. 7.4.1 – To proceed, you should go back to the “Customers” page and then click on the icon that says “manage customer users”.
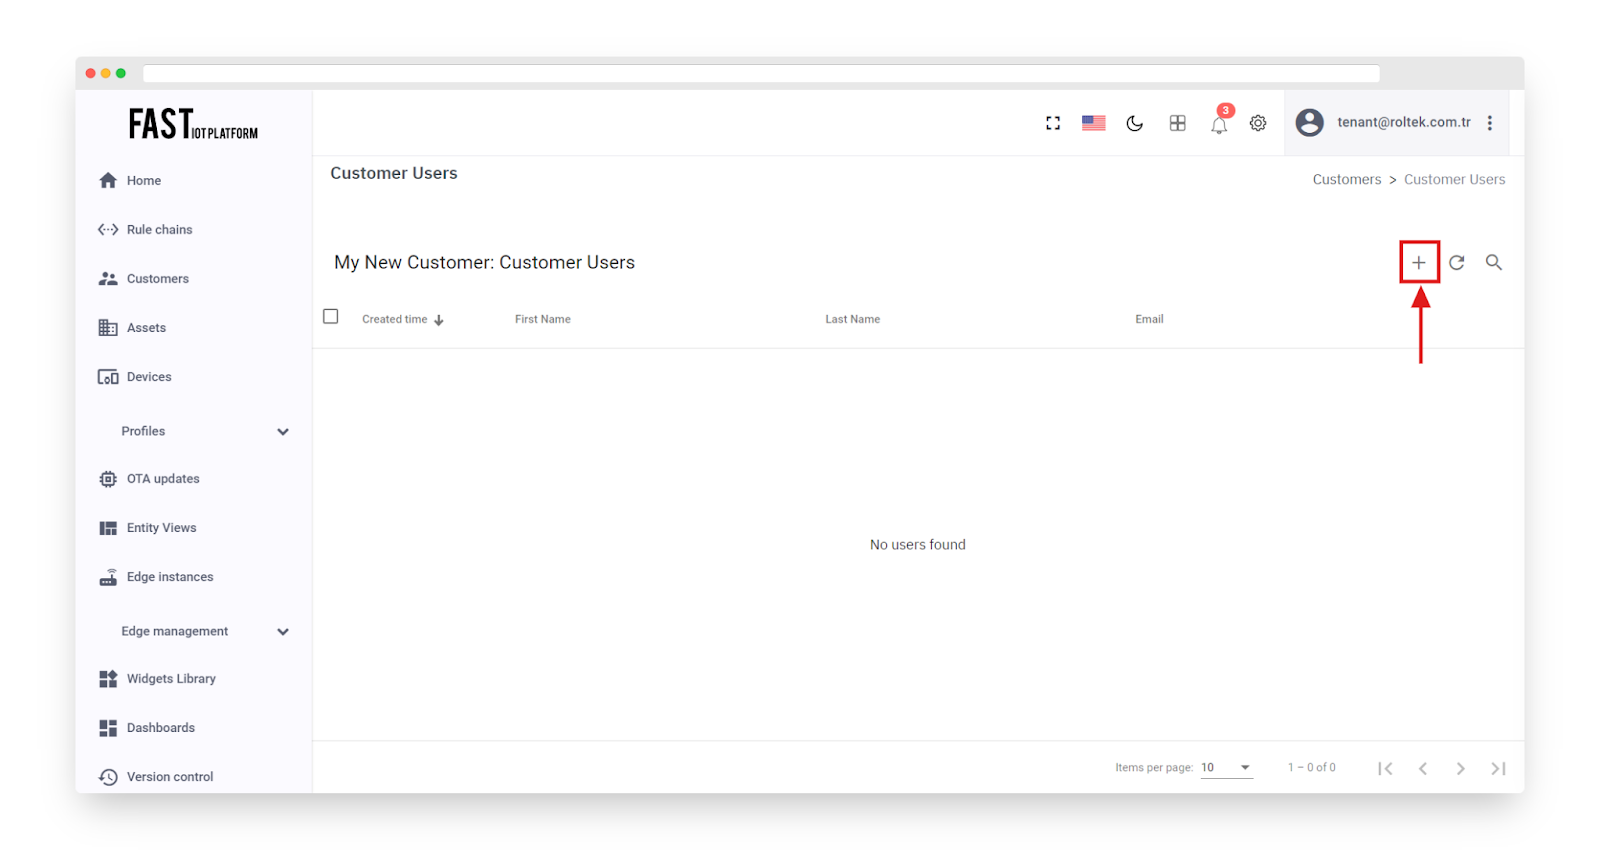
Fig. 7.4.2 – Click the “Add user” icon.
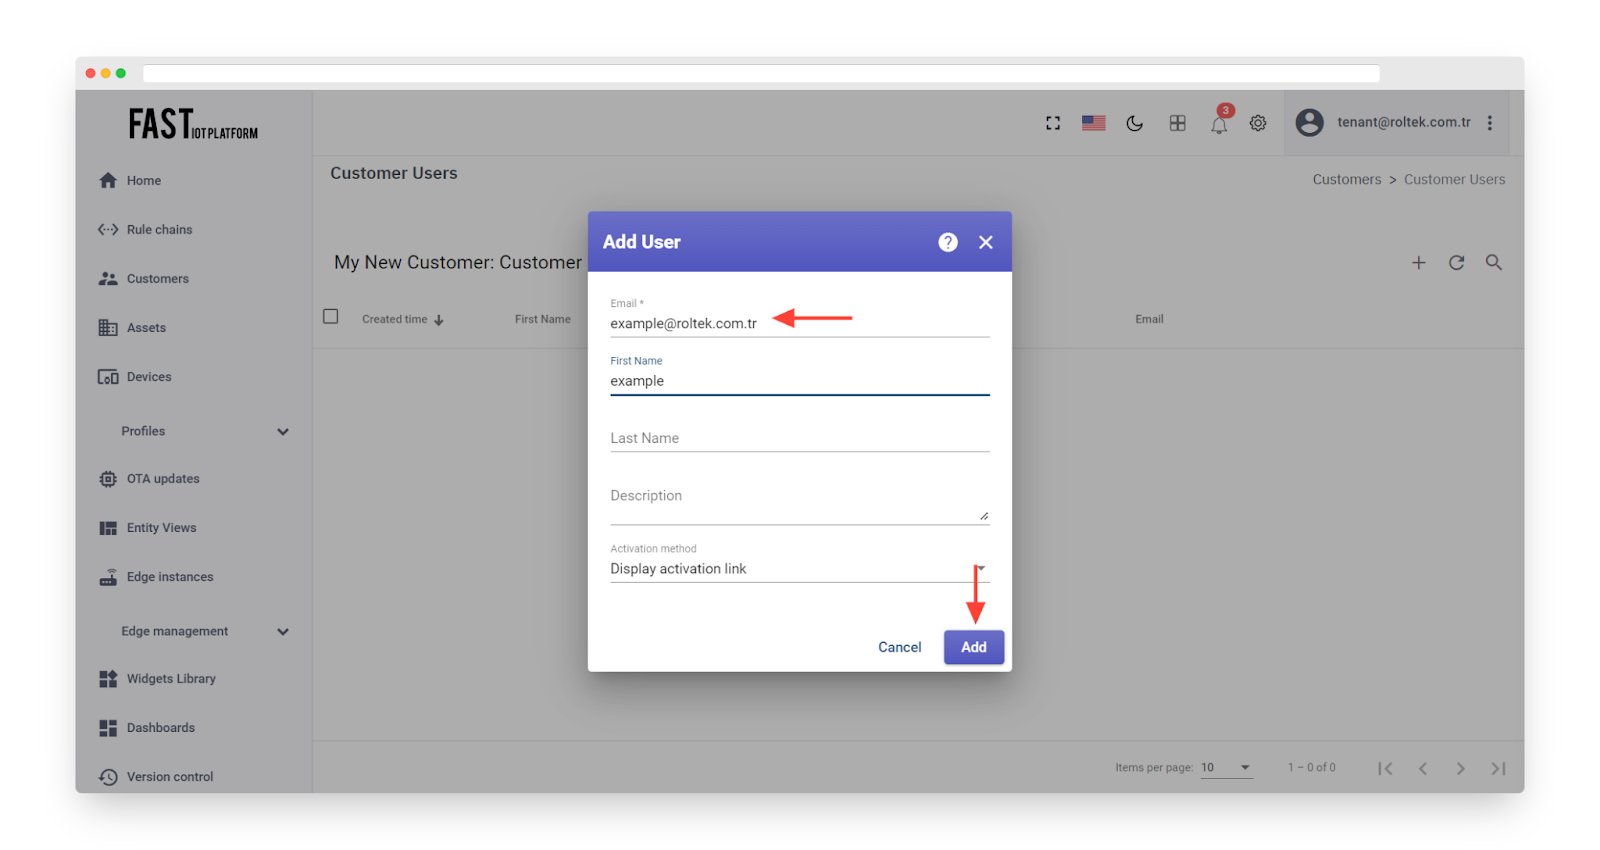
Fig. 7.4.3 – Enter the email address that you plan to use for logging in as a customer user and then click the “Add” button.
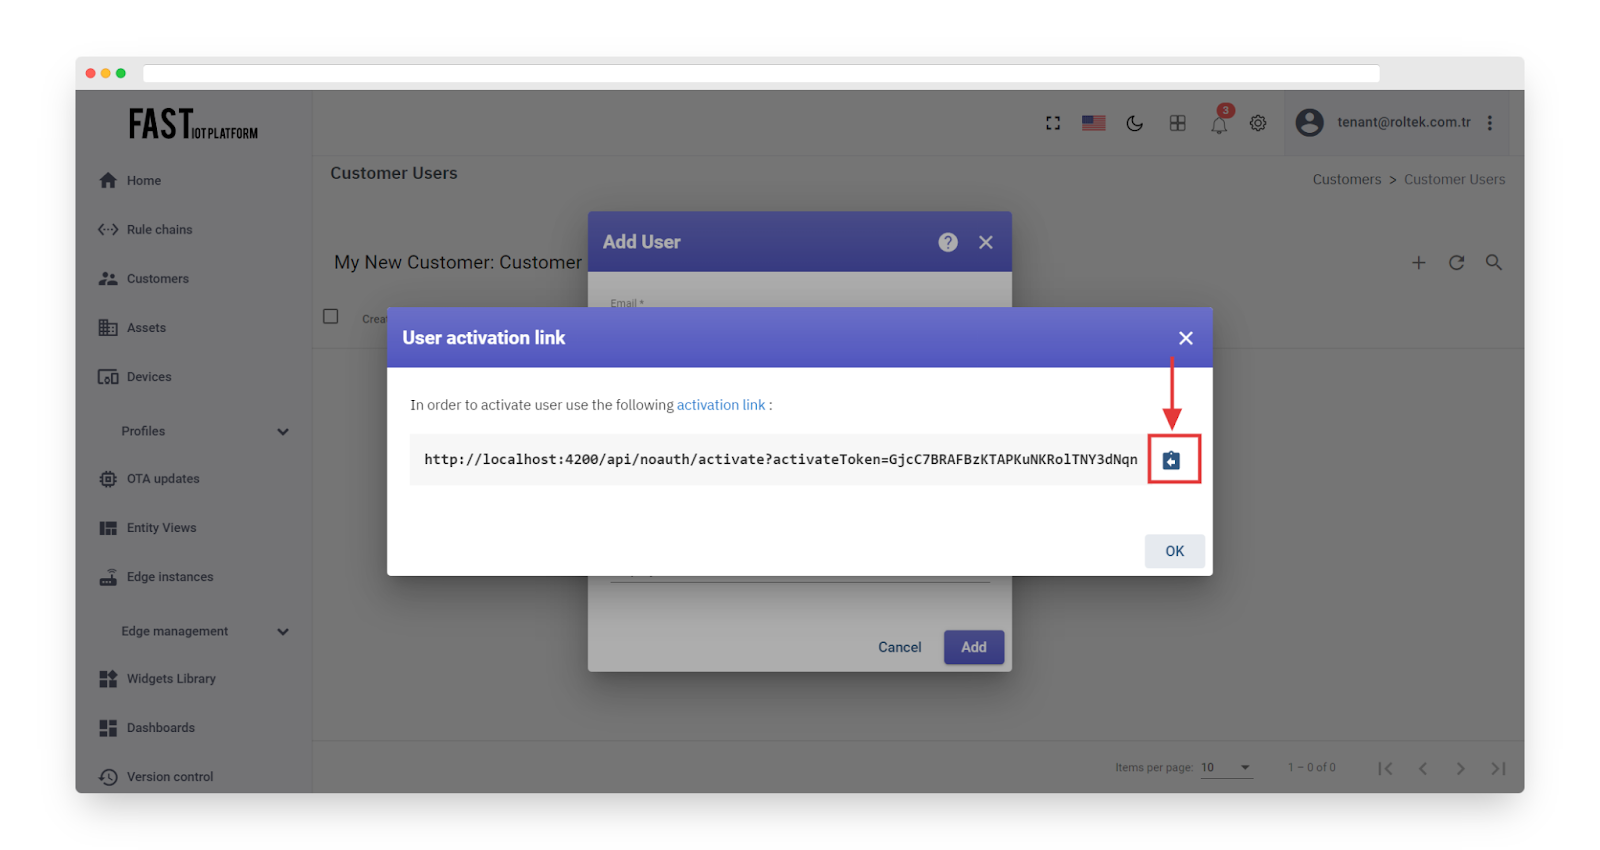
Fig. 7.4.4 – Copy the activation link and save it in a secure location.
Fig. 7.4.5 – Click to open user details.
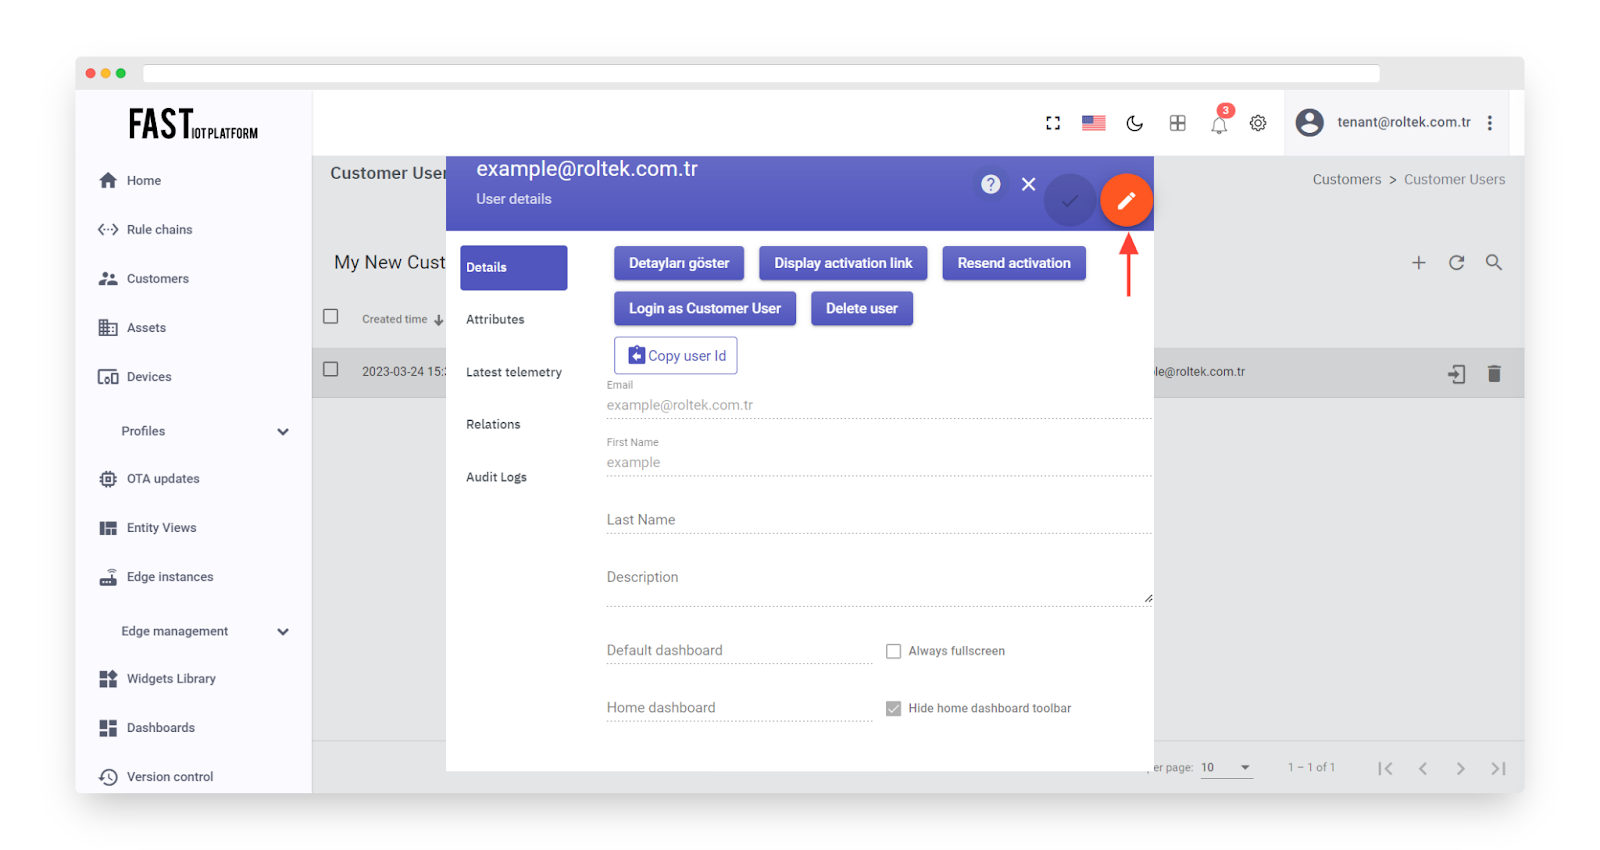
Fig. 7.4.6 – Toggle the edit mode.
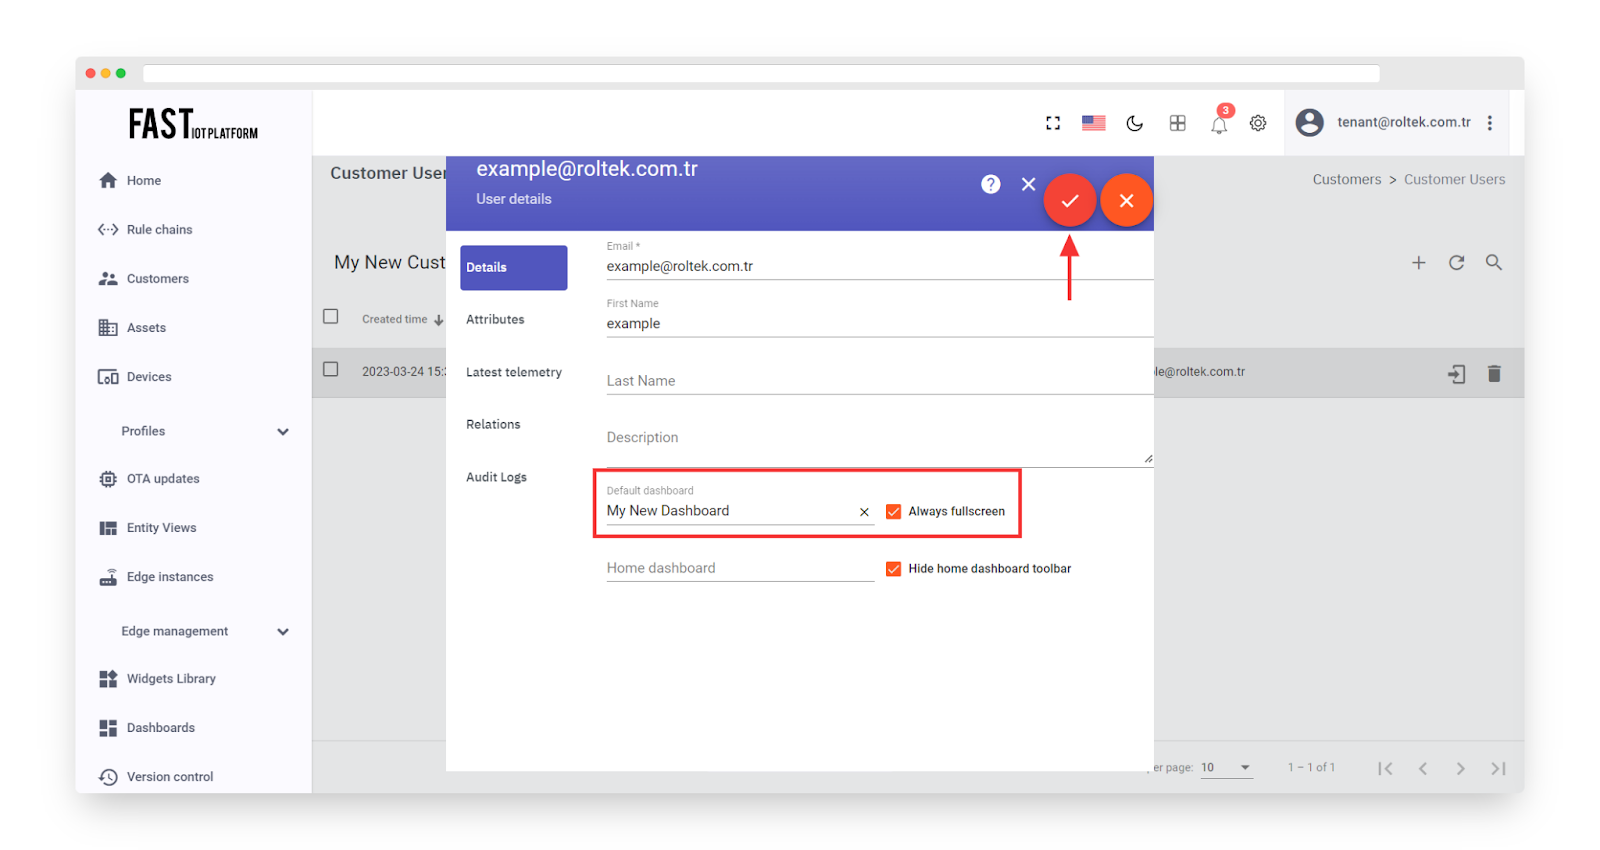
Fig. 7.4.7 – Select default dashboard and check “Always fullscreen”. Apply changes.
Step 7.5 Activate customer user #
To set a password for the customer user, use the activation link that you previously saved, and then click the “Create Password” button. Once you have done this, you will automatically be logged in as a customer user. From here, you can browse the data and take action to acknowledge or clear alarms as necessary.
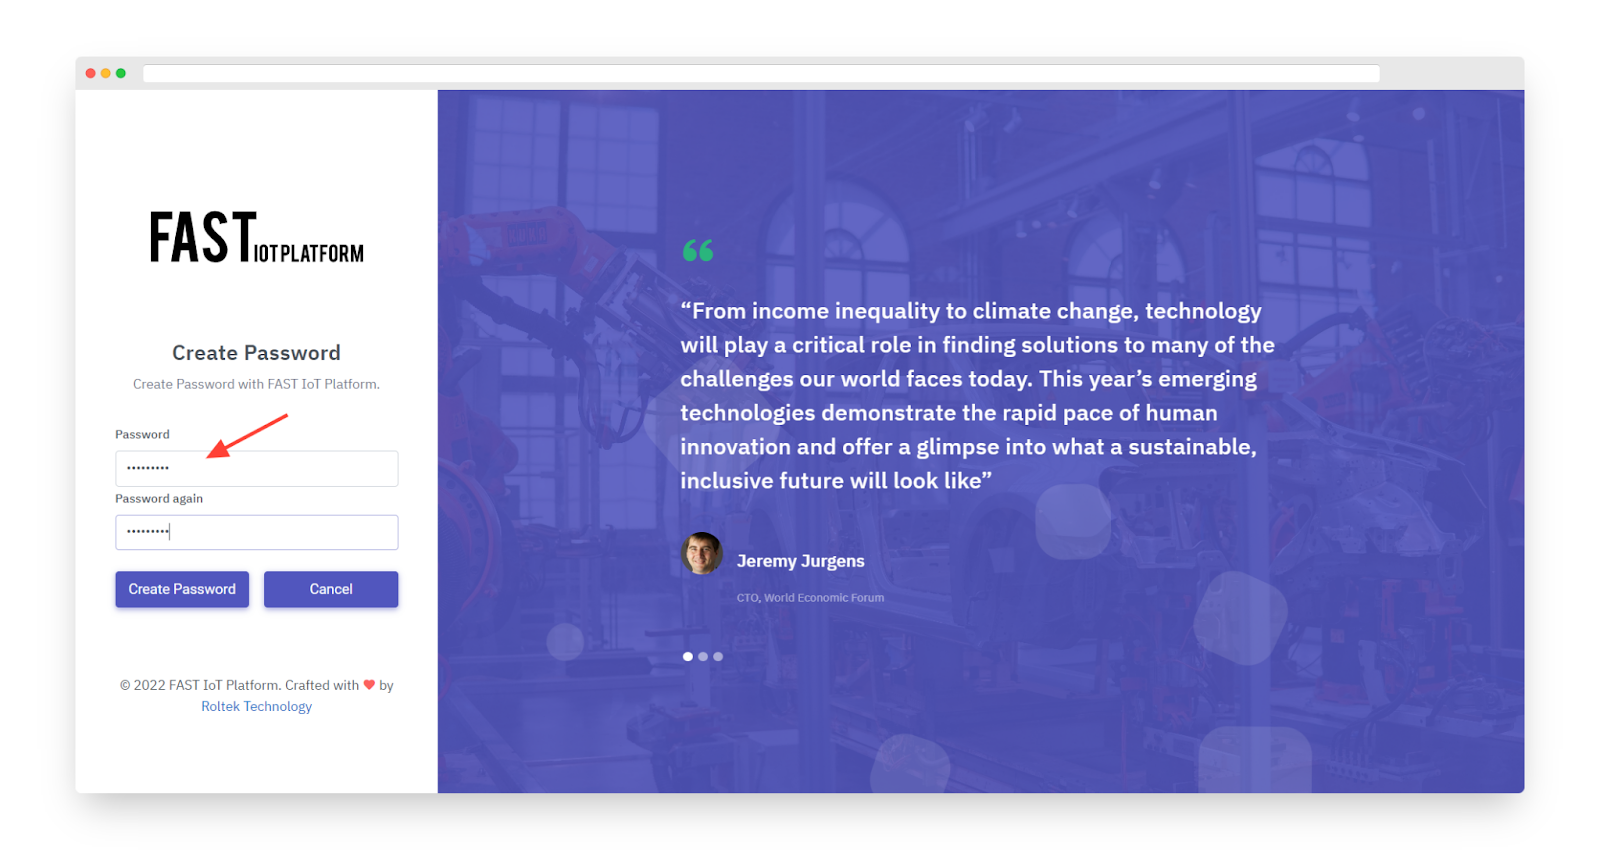
Fig. 7.5.1 – Use the activation link to set the password. Click “Create Password”. You will automatically login as a customer user.
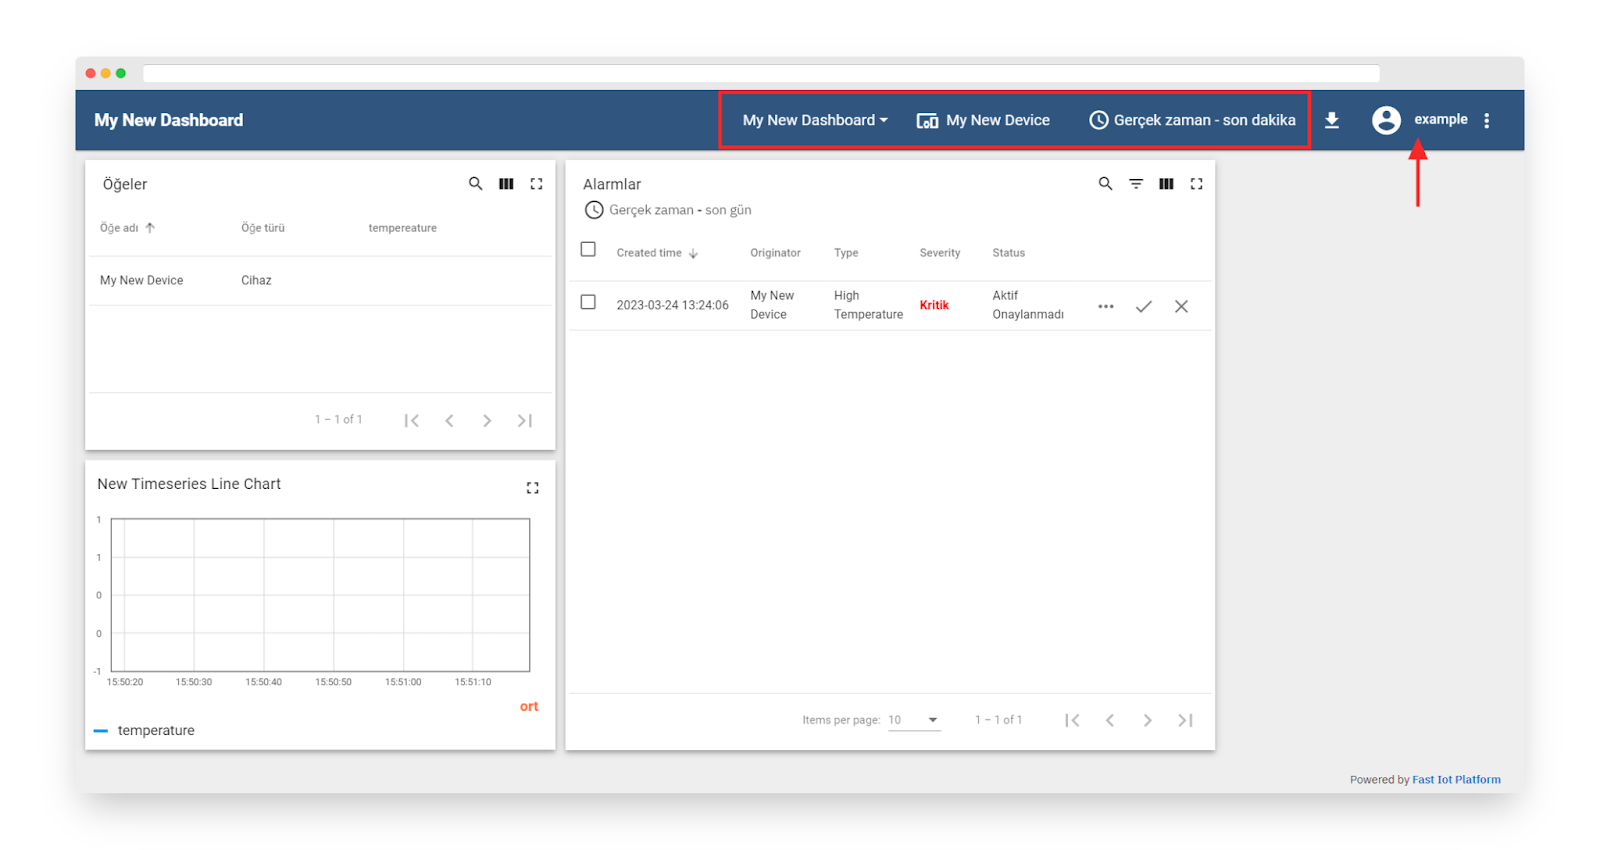
Fig. 7.5.2 – You have logged in as a Customer User. You may browse the data and acknowledge/clear alarms.
Rule Engine Overview #
https://Fast IoT Platform.io/docs/user-guide/rule-engine-2-0/overview/
FAST IoT PLATFORM Rule Engine is a sophisticated system designed for processing complex events, which is highly customizable and configurable. Using the rule engine, you can filter, enrich and transform incoming messages from IoT devices and associated assets. Additionally, you can trigger a range of actions, such as notifications or communication with external systems.
Key Concepts #
Rule Engine Message #
A Rule Engine Message is a serializable and immutable data structure that represents various messages within the system. These can include:
-
Incoming telemetry, attribute updates, or RPC calls from devices
-
Entity lifecycle events, such as when an entity is created, updated, deleted, assigned, unassigned, or when attributes are updated
-
Device status events, such as when a device is connected, disconnected, active, inactive, etc.
-
Other system events
A Rule Engine Message contains the following information:
-
Message ID: a universally unique identifier based on time
-
Originator of the message: the identifier for the device, asset, or other entity that originated the message
-
Type of message: e.g. “Post telemetry” or “Inactivity Event”
-
Payload of the message: a JSON body containing the actual message payload
-
Metadata: a list of key-value pairs containing additional data about the message.
Rule Node #
A Rule Node is a fundamental component of the Rule Engine that processes a single incoming message at a time and produces one or more outgoing messages. The Rule Node is the main logical unit of the Rule Engine. A Rule Node can filter, enrich, or transform incoming messages, perform actions, or communicate with external systems.
Rule Node Connection #
Rule Nodes can be connected to other Rule Nodes, with each connection having a relation type that labels the logical meaning of the relation. When a Rule Node produces an outgoing message, it always specifies the relation type, which is used to route the message to the next nodes.
Typical relation types for Rule Nodes include “Success” and “Failure”. Rule Nodes representing logical operations may use “True” or “False”. Some specific Rule Nodes may use completely different relation types, such as “Post Telemetry”, “Attributes Updated”, “Entity Created”, and so on.
Some Rule Nodes support custom connection names. Simply enter your custom connection name and click the “Create a new one!” link:
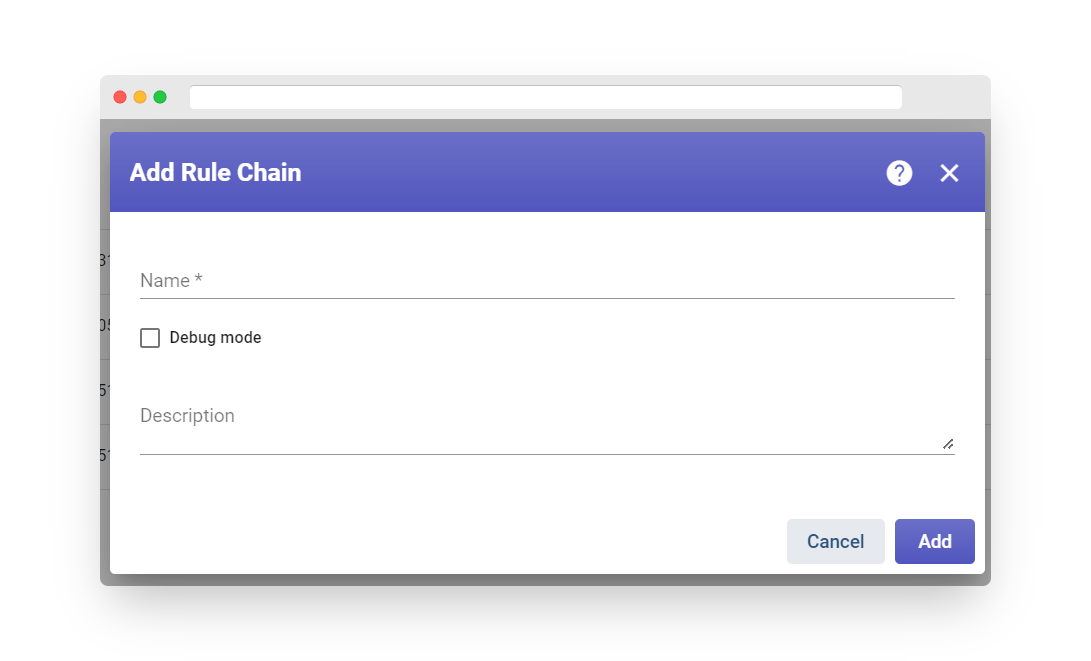
Fig. 1.1 – Add Rule Chain.
All connection names are case-sensitive.
Rule Chain #
In the FAST IoT PLATFORM Rule Engine, a Rule Chain is a logical group of Rule Nodes and their relations. For example, the following Rule Chain:
-
Saves all telemetry messages to the database
-
Raises a “High Temperature Alarm” if the temperature field in the message is higher than 50 degrees
-
Raises a “Low Temperature Alarm” if the temperature field in the message is lower than -40 degrees
-
Logs failures to execute the temperature check scripts to the console in case of logical or syntax errors in the script.
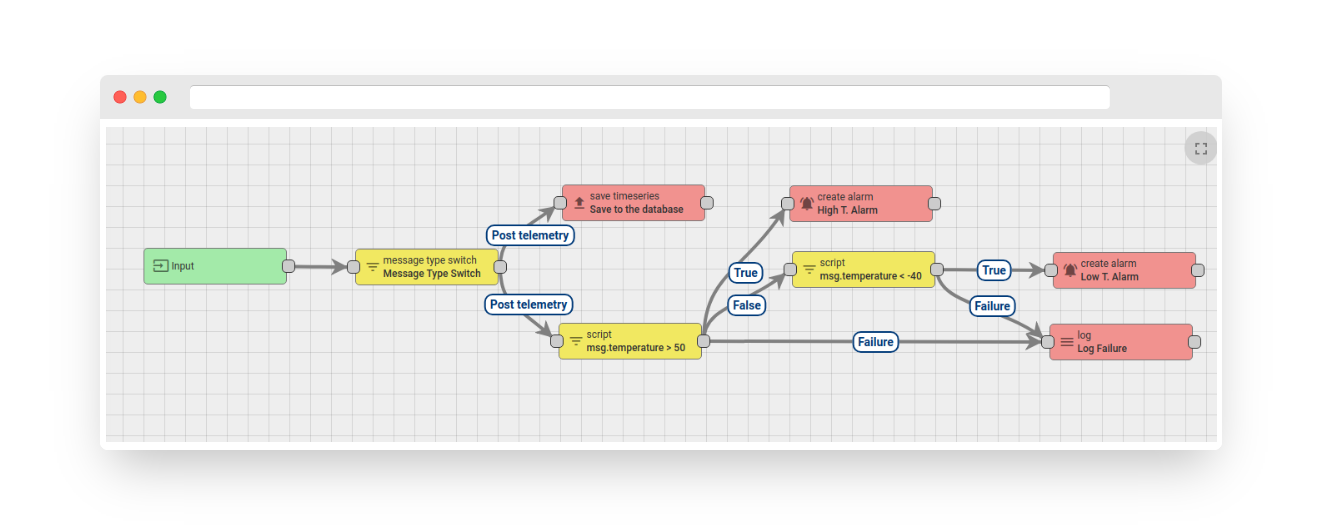
Fig. 1.2 – Rule Chain.
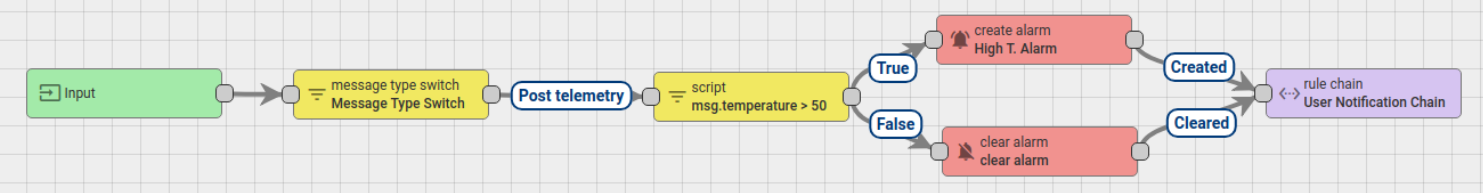
The tenant administrator has the ability to define a single Root Rule Chain, and optionally multiple other rule chains. The Root Rule Chain will handle all incoming messages and can forward them to other rule chains for further processing. Other rule chains may also forward messages to different rule chains.
For example, the following rule chain will:
-
Trigger a “High Temperature Alarm” if the temperature field in the message is greater than 50 degrees
-
Clear the “High Temperature Alarm” if the temperature field in the message is less than 50 degrees
-
Forward notifications about “Created” and “Cleared” alarms to an external rule chain that handles notifications to the corresponding users.
Message Processing Result #
There are three potential outcomes of message processing: Success, Failure, and Timeout. A message processing attempt is marked as “Success” if the last rule node in the processing chain successfully processes the message. A message processing attempt is marked as “Failure” if one of the rule nodes produces a “Failure” in message processing and there are no rule nodes to handle that failure. A message processing attempt is marked as “Timeout” when the overall processing time exceeds a configurable threshold.
Please see the diagram below and let’s review the possible scenarios:
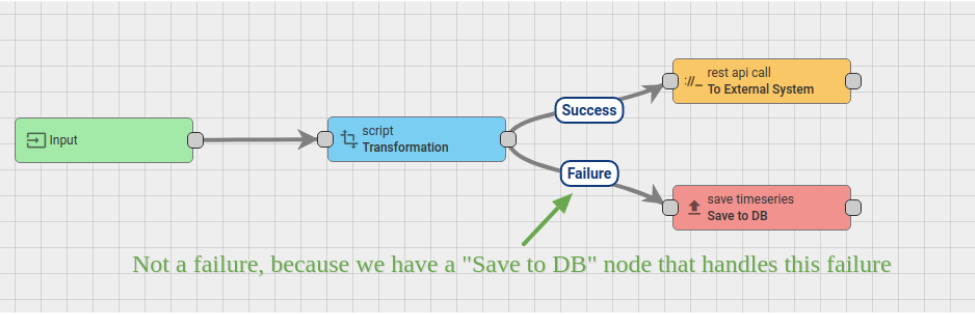
If the “Transformation” script fails, the message is not marked as “Failed” because there is a “Save to DB” node connected with a “Failure” relation. If the “Transformation” script is successful, it will be pushed to the “External System” with a REST API call. If the external system is overloaded, the REST API call may hang for some time. Let’s assume the overall timeout for message pack processing is 20 seconds. Let’s ignore the Transformation script execution time because it is <1ms. If the “External System” replies within 20 seconds, the message will be successfully processed. Similarly, if the “Save to DB” call succeeds, the message will be successfully processed. However, if the external system does not reply within 20 seconds, the message processing attempt will be marked as “timed-out”. Similarly, if the “Save to DB” call fails, the message will be marked as failed.
Rule Engine Queue #
See new documentation
Queue submit strategy #
See new documentation
Queue processing strategy #
See new documentation
Default queues #
See new documentation
Predefined Message Types #
List of the predefined Message Types is presented in the following table:
code
Rule Node Types #
The available rule nodes are categorized based on their purpose:
-
Filter nodes are used to filter and route messages.
-
Enrichment nodes are used to update metadata of incoming messages.
-
Transformation nodes are used to modify incoming message fields such as originator, type, payload, and metadata.
-
Action nodes execute various actions based on incoming messages.
-
External nodes are used to interact with external systems.
Configuration #
Each Rule Node may have specific configuration parameters that depend on the Rule Node Implementation. For example, the “Filter – script” rule node is configurable via a custom JS function that processes incoming data. The “External – send email” node configuration allows you to specify mail server connection parameters.
The Rule Node configuration window can be opened by double-clicking on the node in the Rule Chain editor.
Debugging #
Fast IoT Platform offers users the ability to review incoming and outgoing messages for each Rule Node, which can aid in the process of debugging. To enable the debug feature, users need to ensure that the “Debug mode” checkbox is checked in the main configuration window (the first image in the Configuration section illustrates this).
After enabling debug mode, users can view information about incoming and outgoing messages, along with their corresponding relation types.
Import/Export #
To transfer your rule chain to another Fast IoT Platform instance or simply save it in JSON format, you can utilize the export function provided by the platform. To begin, navigate to the Rule Chains page and locate the specific rule chain that you wish to export. Then, click on the export button that is situated on the corresponding rule chain card. This will generate a JSON file that contains all the necessary data to recreate the same rule chain in a different Fast IoT Platform instance.
To import a rule chain in JSON format to your Fast IoT Platform instance, follow these steps: go to the Rule Chains page, locate the large “+” button situated in the lower-right corner of the screen, and click on it. This will bring up a new window where you can select the import button. Once you click on the import button, you can choose the JSON file containing the rule chain data that you wish to import. After selecting the file, Fast IoT Platform will validate the data and import the rule chain to your instance.
Custom REST API calls to Rule Engine #
Fast IoT Platform provides an API for sending custom REST API calls to the rule engine, processing the payload of the request, and returning the result of the processing in the response body. This feature is useful for various use cases, such as:
Extending the existing REST API of the platform with custom API calls.
Enriching a REST API call with the attributes of a device/asset/customer and forwarding it to an external system for complex processing.
Providing a custom API for your custom widgets.
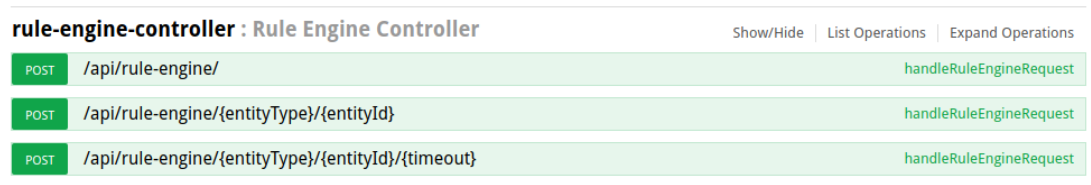
To execute a REST API call, you can use the rule-engine-controller REST APIs.
Note that if you specify an entity ID in your call, that entity will be designated as the originator of the Rule Engine message. If you do not include entity ID parameters, the originator of the message will default to your user entity.
Troubleshooting #
If you are using Kafka queue to process messages, Fast IoT Platform offers the capability to monitor if the rate of pushing messages to Kafka is faster than the rate of consuming and processing them. In such cases, there will be an increasing delay in message processing. To activate this functionality, you must ensure that Kafka consumer-stats are enabled by referring to the queue.kafka.consumer-stats section of the Configuration properties.
Once Kafka consumer-stats are enabled, you will be able to view logs (refer to Troubleshooting) that show the offset lag for consumer groups. These logs include consumer-group logs for tb-core, tb-rule-engine, and all transport services.
Here is an example of the log message:
This message indicates that there are 5 messages that have been pushed to the Main queue (tb_rule_engine.main.0 Kafka topic) but have not yet been processed. This can be deduced from the difference between the two offset values, where 5418 is the latest offset and 5413 is the offset of the last processed message.
In general, the logs follow the following structure:
The logs have the following structure:
CONSUMER_GROUP_NAME – the name of the consumer group responsible for processing messages (could be any of the rule-engine queues, core queue, etc.)
KAFKA_TOPIC – the name of the Kafka topic being monitored
KAFKA_TOPIC_PARTITION – the partition number of the Kafka topic
LAST_PROCESSED_MESSAGE_OFFSET – the sequence number of the last message processed by the consumer (last acknowledged message in the Rule Engine, etc.)
LAST_QUEUED_MESSAGE_OFFSET – the sequence number of the last message successfully pushed to the Kafka topic
LAG – the number of unprocessed messages still present in the Kafka topic partition.
NOTE: Logs regarding consumer lag will only be displayed if there is a lag present for that particular consumer group.
Filter Nodes #
Filter Nodes are utilized for message filtering and routing purposes. Below is a list of available nodes.
Asset profile switch #
This feature allows incoming messages to be routed based on the name of the asset profile, taking into account the case sensitivity of the profile name. It has been available since version 3.4.4.
Output
The output connection of the rule node is linked to the asset profile name, such as “Freezer Room”, “Building”, and so on. Please refer to the connections of the rule node for further information.
Usage example
Experienced users of the platform make use of Asset Profiles and configure specific rule chains for each profile. This is a convenient way to automatically direct the platform-generated messages, such as Asset Created, Deleted, Attribute Updated, etc. However, most of the messages are generated from the sensor data. Let’s say we have temperature sensors installed in the assets of two rooms, namely “Freezer Room” and “Boiler Room”, which are related to the temperature devices using the “Contains” type relation. The following rule chain changes the source of the message from the device to the associated asset, and then directs incoming messages to the appropriate rule chain for either “Freezer Room” or “Boiler Room”.
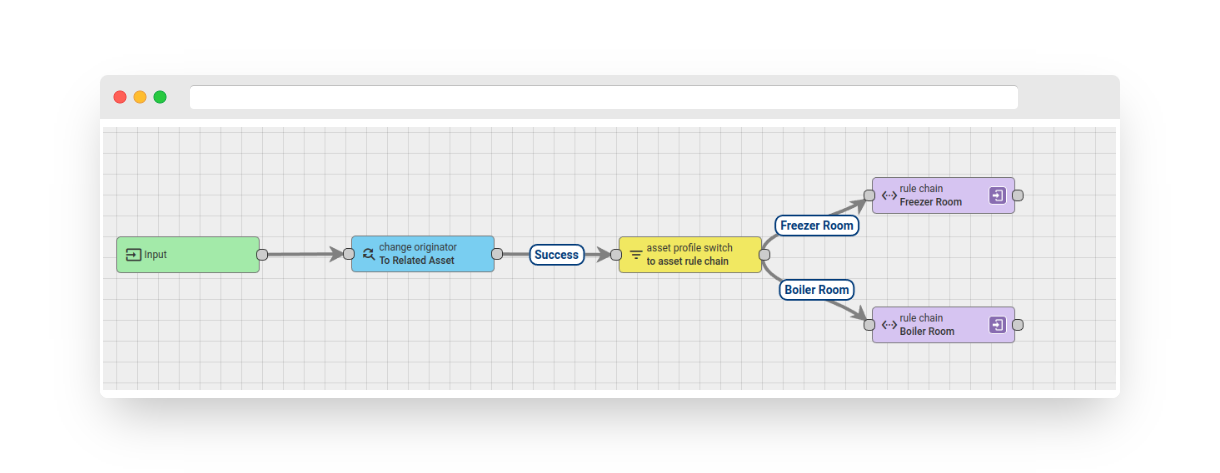
Fig. 1 – Rule chain: asset profile switch
You can download and import the rule chain, but keep in mind that the “rule chain” nodes may refer to non-existent rule chains in your specific environment.
Device profile switch #
Incoming messages can be routed according to the device profile name, with attention paid to case sensitivity. This feature has been available since v3.4.4.
Output
The output connection of the rule node corresponds to the device profile name, such as “Temperature sensor”, “Humidity sensor”, and so on. For additional information, please refer to the connections of the rule node.
Usage example
Experienced users of the platform make use of Device Profiles and configure specific Rule Chains for each Device Profile. This is generally a helpful approach, except in situations where the device data is obtained from another message source. For instance, if you are using a BLE to MQTT gateway in combination with BLE beacons, the payload of the gateway usually includes the MAC address of the beacon as well as the beacon data:
Let’s assume you have different beacon profiles – indoor air quality (“IAQ sensor”) and leak sensors (“Leak sensor”). The following rule chain will change the message source from the gateway to the device and direct the message to the appropriate rule chain:

Fig. 2 – Rule chain: device profile switch
You can download and import the rule chain, but please note that the “rule chain” nodes may refer to non-existent rule chains in your specific environment.
Check alarm status #
This function verifies whether the Alarm status corresponds to one of the specified statuses.
Configuration
The alarm status filter contains a list of alarm statuses, including: ‘Active Acknowledged’, ‘Active Unacknowledged’, ‘Cleared Acknowledged’, and ‘Cleared Unacknowledged’.
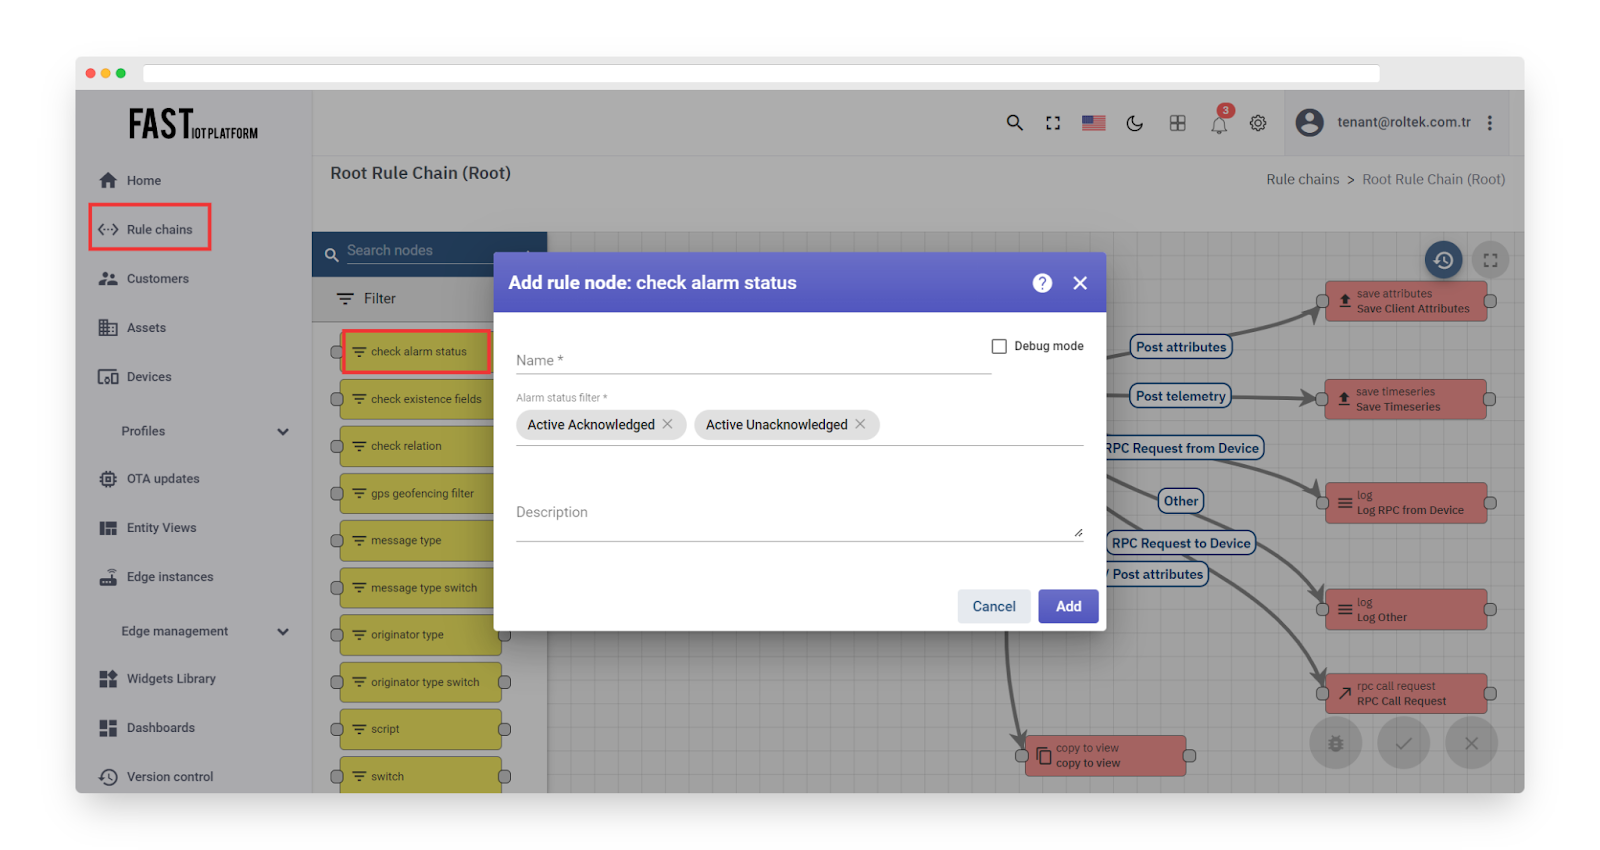
Fig. 3.1 – Add check alarm status
Output
Output connection types: “True” or “False”.
Example
Rule chain listed below verifies whether the acknowledged alarm is currently active or has already been cleared.
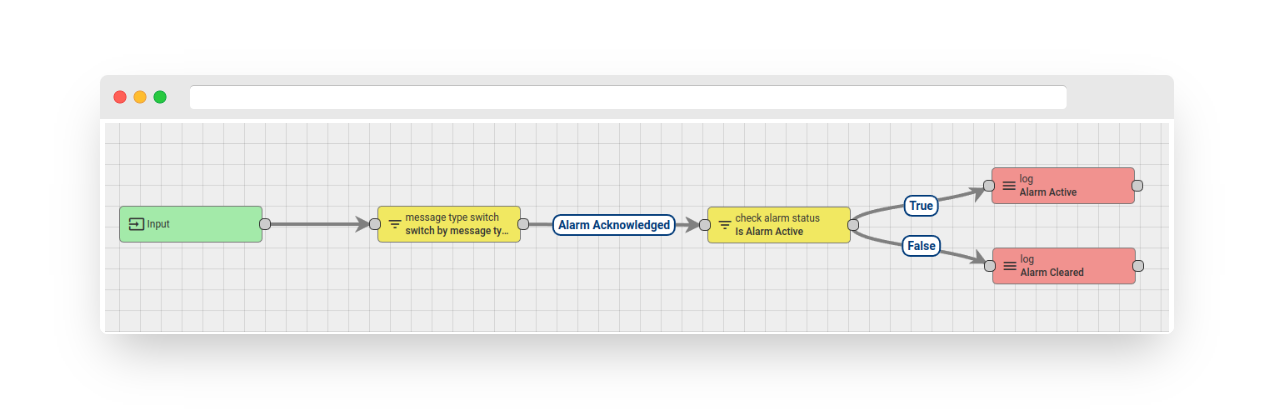
Fig. 3.2 – Rule chain: check alarm status
You have the option to download and import the rule chain.
Check fields presence #
The function verifies whether the designated fields exist in the message and/or metadata. The message and metadata are usually represented as a JSON object. The user defines the names of the message and/or metadata fields in the configuration.
Configuration
-
Message field names refer to the list of field names that must be present in the message.
-
Metadata field names refer to the list of field names that must be present in the metadata.
-
The ‘Check that all specified fields are present’ checkbox allows the user to check the presence of all specified fields (if checked) or at least one field (if unchecked).
Output
Output connection types: “True” or “False”.
Example
See configuration screenshot.
Check relation #
The function verifies the existence of the relationship between the sender of the message and other entities. If ‘check relation to specific entity’ is chosen, the user must provide the name of the related entity. If not, the rule node verifies the presence of a relationship with any entity that meets the direction and relationship type criteria.
Configuration
-
The ‘check relation to specific entity’ checkbox allows the user to specify a particular entity to check the relationship with.
-
The ‘Direction’ option configures the direction of the relationship, which can be either ‘From’ or ‘To’. This value determines the direction of the relationship from the specified/any entity to the originator. See the example below.
-
The ‘Relation type’ option allows the user to define an arbitrary relation type. The default relation types are ‘Contains’ and ‘Manages’, but the user can create a relation of any type.
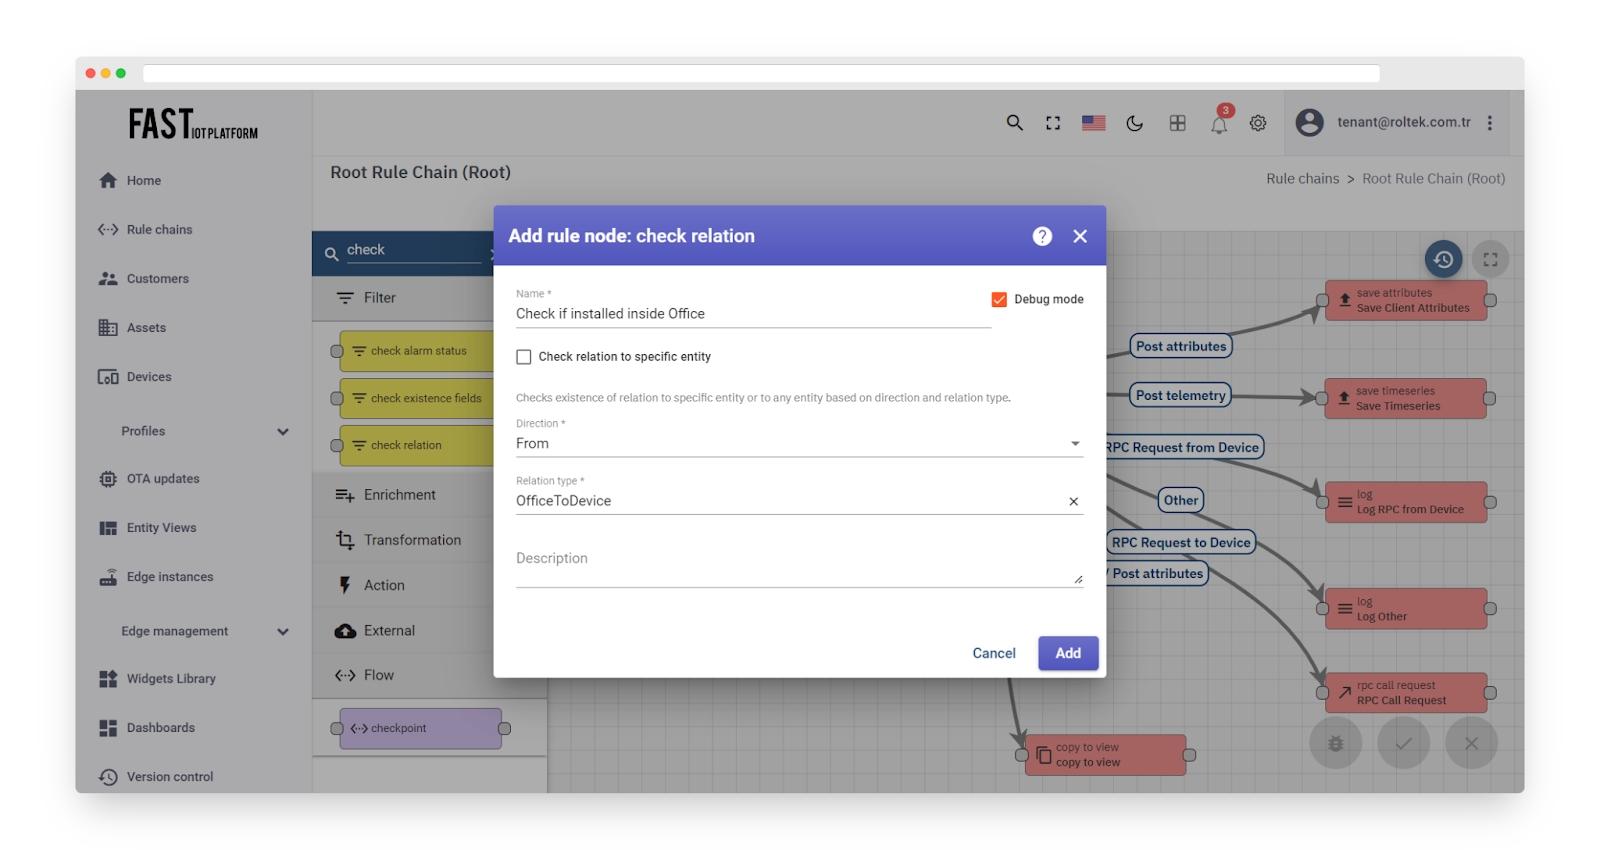
Fig. 4 – Add check relation
Output
Output connection types: “True” or “False”.
Example
Suppose you have a temperature sensor located both inside the office and in the warehouses. When processing the data, you may want to know whether the sensor is located in the office or the warehouse. To achieve this, you need to create an “OfficeToDevice” relationship from the Office asset to the sensor device located in the office.
Please refer to the configuration screenshot to learn how to configure the rule node for this specific case.
Entity type #
“The function filters incoming messages based on the type of entity that originated the message. It verifies whether the entity type of the message originator matches one of the specified values in the filter.
Configuration
-
The Originator Types Filter is a list of entity types, such as Device, Asset, User, etc.
Output
Output connection types: “True” or “False”.
Example
See configuration screenshot.
Entity type switch #
The function routes incoming messages based on the type of entity that originated the message.
Output
The output connection of the rule node corresponds to the entity type of the message originator, such as “Device”, “Asset”, “User”, etc.
Example
Assuming that you have messages from various entities processed within a single rule chain, you may want to split the message flow based on the entity type. An example is shown below:
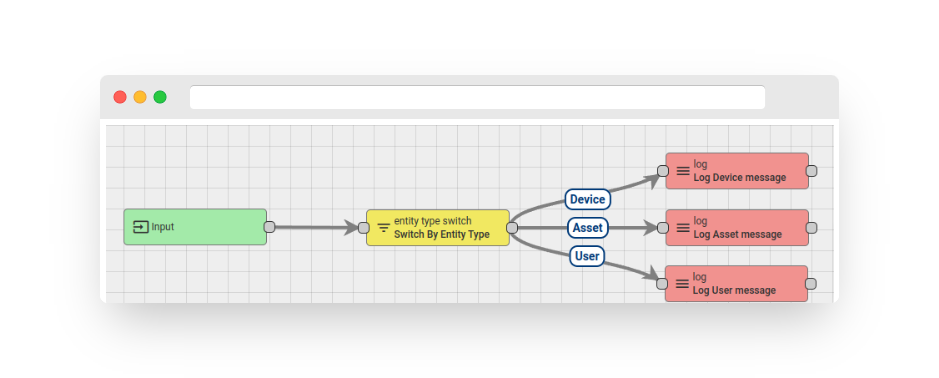
Fig. 5 – Rule chain: entity type switch
Message type #
The process involves screening incoming messages and sorting them according to predefined or customized message types. It verifies whether the message type of each incoming message corresponds to any of the designated filter values.
Configuration
-
The filter for message types includes a roster of predetermined message types, with the added option of incorporating custom message types.
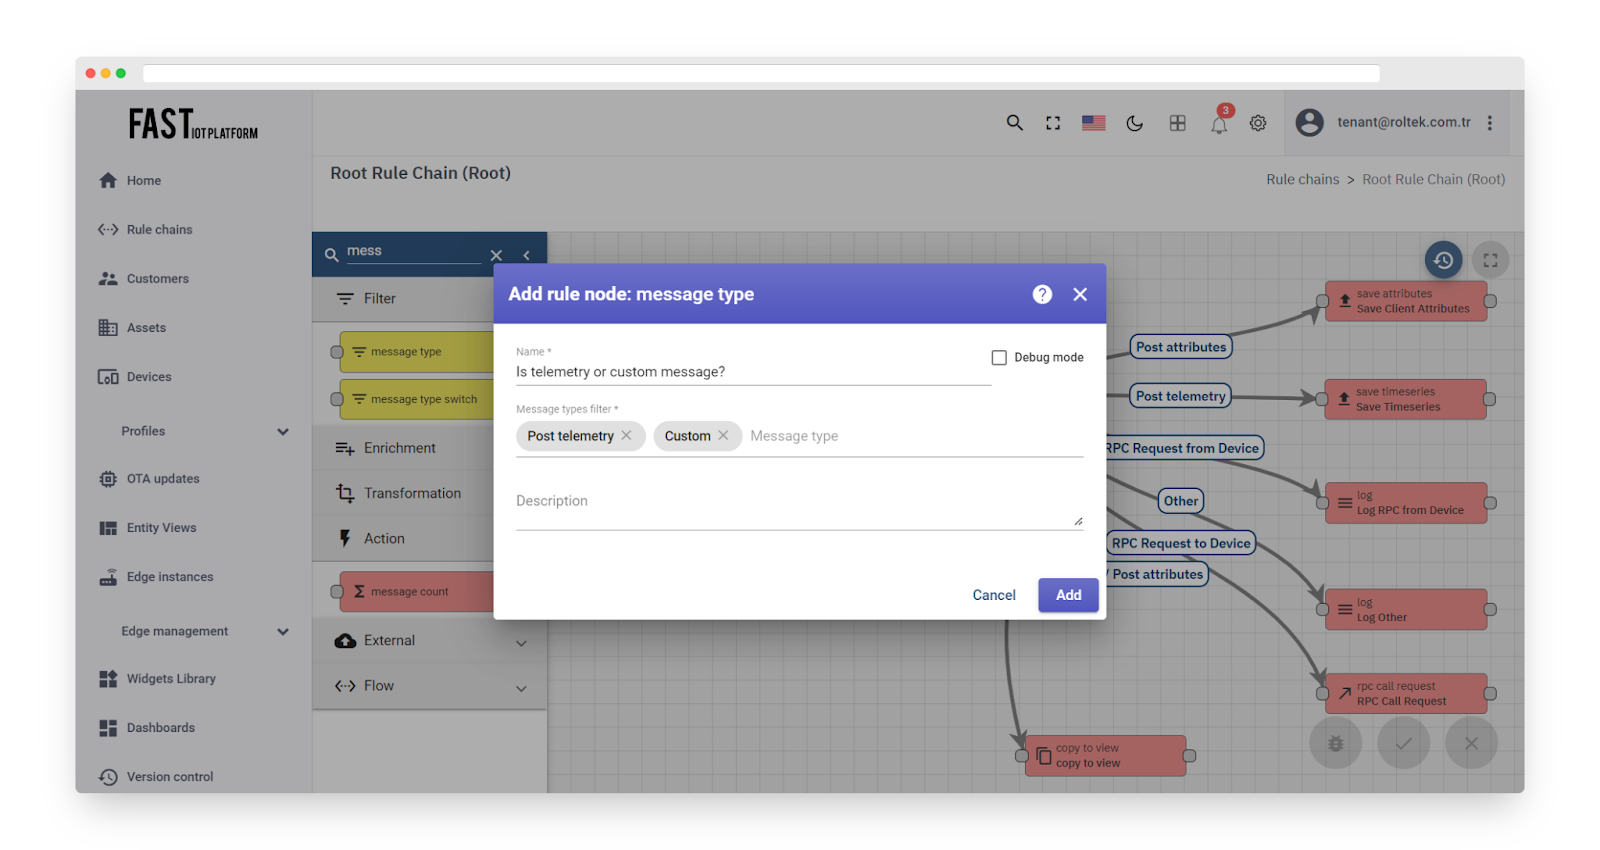
Fig. 6 – Add message type
Output
Output connection types: “True” or “False”.
Example
See configuration screenshot.
Message type switch #
Incoming messages are directed to their respective chains based on the message type value. If the incoming message has a recognized message type, it is routed to the corresponding chain. Otherwise, it is sent to the “Other” chain.
In case custom message types are utilized, they can be routed through the “Other” chain of the Message Type Switch Node to the message type with the necessary routing logic configured.
Output
The output connection of the rule node corresponds to the entity type of the message originator, such as “Device”, “Asset”, “User”, etc.
Example
Assuming that you have messages from various entities processed within a single rule chain, you may want to split the message flow based on the entity type. An example is shown below:
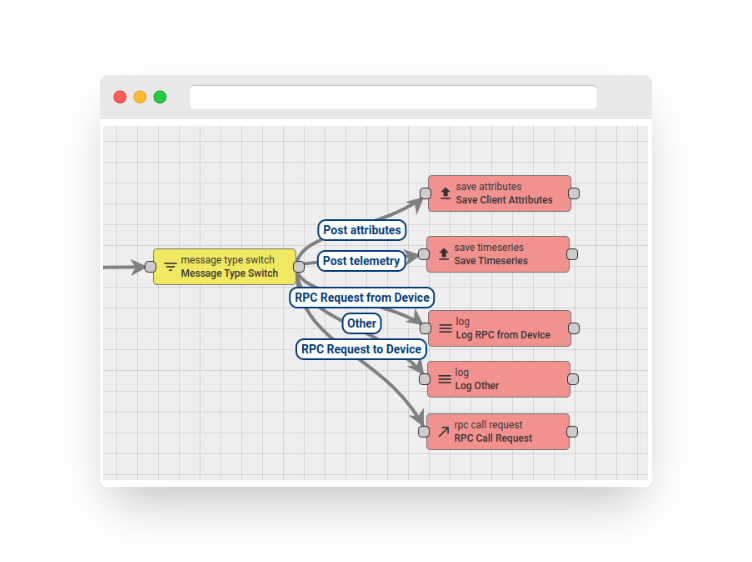
Fig. 7 – Rule chain: message type switch
Script #
An incoming message is used to assess a Boolean function, which can be composed using TBEL (recommended) or plain JavaScript. The script function should return a Boolean value and accept three parameters.
Configuration
The TBEL/JavaScript function accepts three input parameters:
-
msg is the message payload, usually presented as a JSON object or array.
-
metadata is the metadata associated with the message. It is represented as a Key-Value map, with both keys and values in string format.
-
msgType is the string message type.
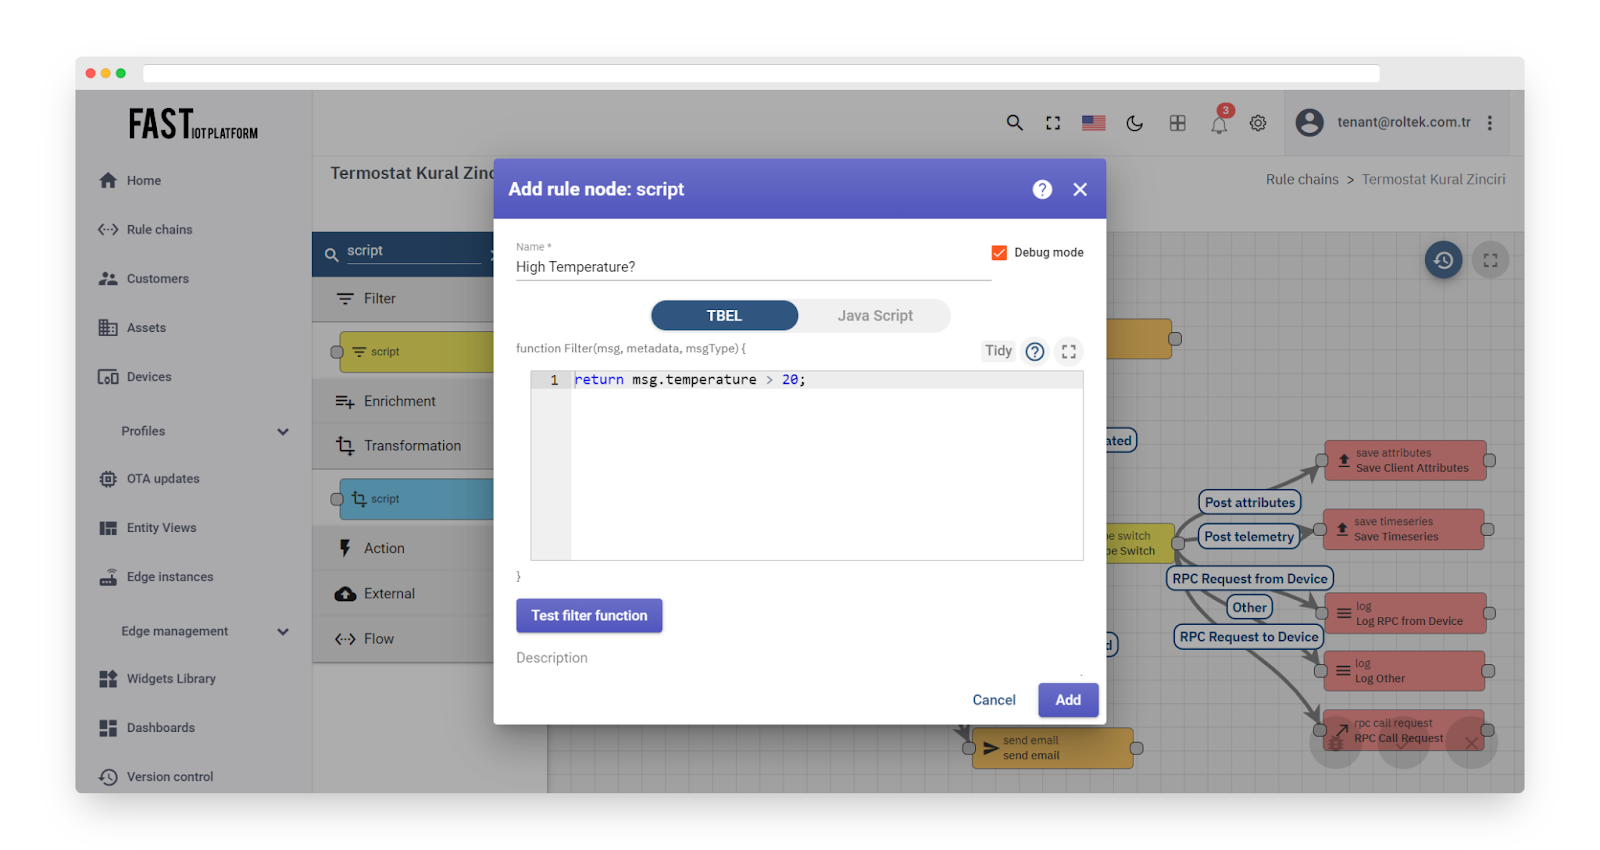
Fig. 8 – Add script
Output
Output connection types: “True” or “False”.
Example
The message payload can be accessed using the “msg” variable, for instance: “msg.temperature < 10;”
The message metadata can be accessed through the “metadata” variable, for example: “metadata.deviceType === ‘DHT11’;”
The message type can be accessed using the “msgType” variable, for example: “msgType === ‘POST_TELEMETRY_REQUEST'”
Here is a full example of a script:
The TBEL/JavaScript condition can be validated using the test filter function.
Switch #
This node directs incoming messages to one or more output connections. The node executes a configured TBEL (recommended) or JavaScript function that returns an array of strings (connection names).
Configuration
The TBEL/JavaScript function accepts three input parameters:
-
msg represents the message payload, usually as a JSON object or array.
-
metadata represents the message metadata and is presented as a Key-Value map. Both keys and values are in string format.
-
msgType is the string message type.
The script must return an array of the next relation names where the message should be directed. If the returned array is empty, the message will not be routed to any node and will be discarded.
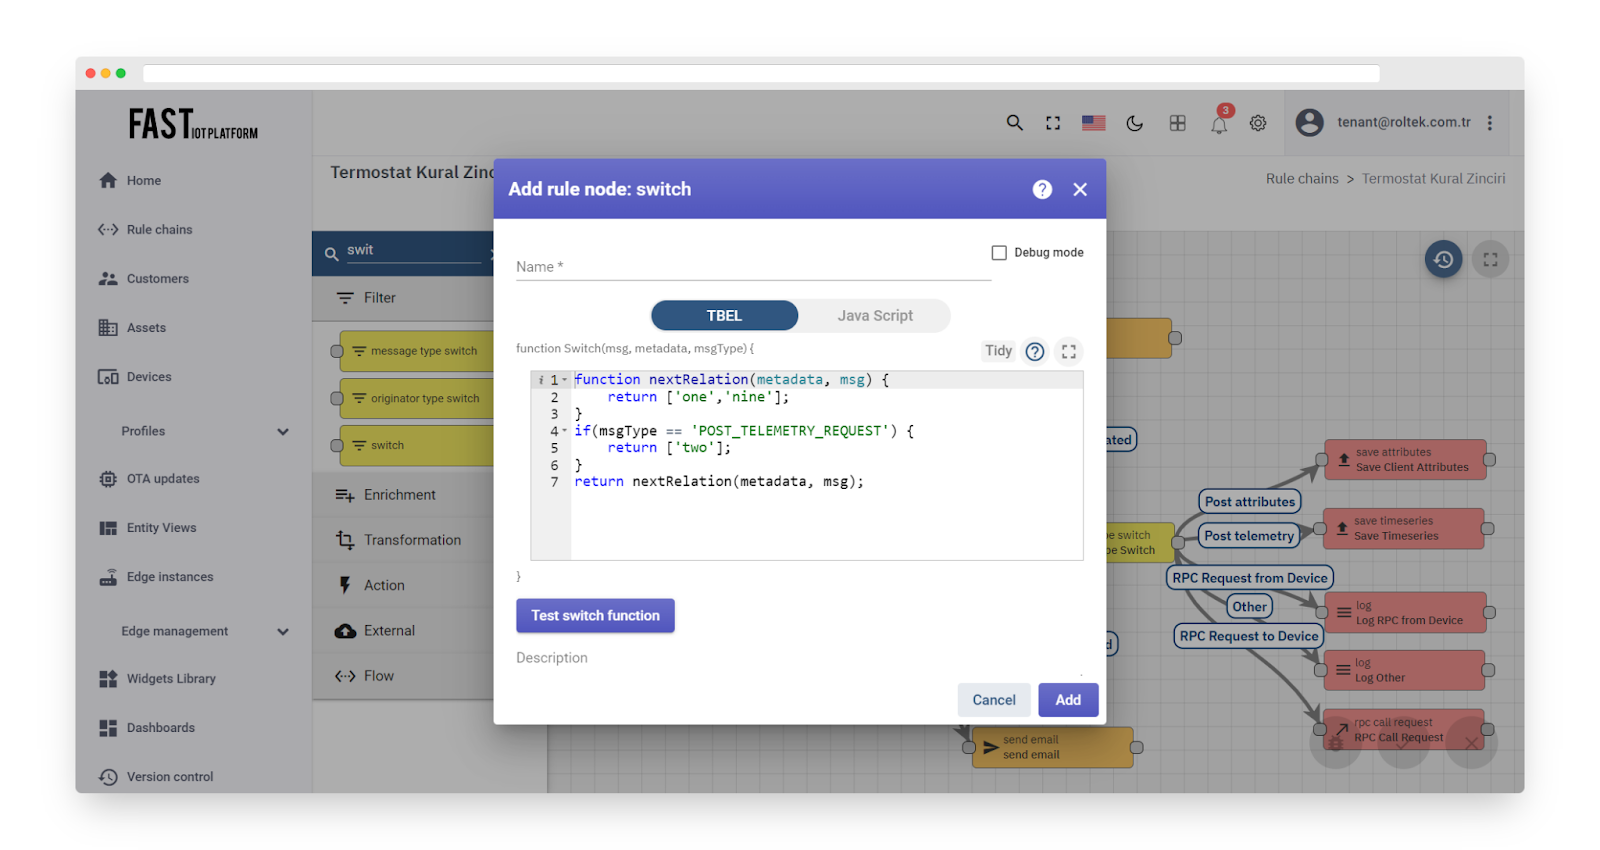
Fig. 9.1 – Add switch
Output
The output connection of the rule node corresponds to the result of the script execution. For instance, it could be “Low Temperature Telemetry,” “Normal Temperature Telemetry,” “Idle State,” and so on. For more information, see the rule node connections.
Example
Here are some possible ways to rewrite the given sentences:
The message payload can be accessed through the “msg” variable. For instance, you can check if the temperature is less than 10 by using the expression “msg.temperature < 10”.
The metadata of the message is available through the “metadata” variable. For instance, you can verify if the customer’s name is “John” by using the expression “metadata.customerName === ‘John'”.
The type of the message is available through the “msgType” variable. For instance, you can check if the message type is “POST_TELEMETRY_REQUEST” by using the expression “msgType === ‘POST_TELEMETRY_REQUEST'”.
Full script example:
To verify a JavaScript condition in TBEL, you can use the test filter function.
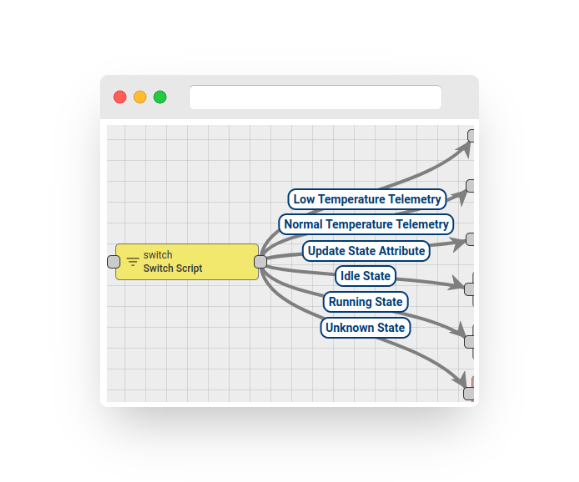
Fig. 9.2 – Rule chain – switch
GPS geofencing filter #
The incoming messages can be filtered based on GPS geofencing. This involves extracting the latitude and longitude parameters from the message and comparing them against the configured perimeter.
Here are the definitions for some of the key terms related to location-based messages:
-
Latitude key name: This is the name of the message field that contains the latitude information for a location-based message.
-
Longitude key name: This is the name of the message field that contains the longitude information for a location-based message.
-
Perimeter type: This refers to the shape of the area around the location that should trigger an action or notification. It can be either a Polygon or a Circle.
-
Fetch perimeter from message metadata: This is a checkbox option that should be enabled if the perimeter for the location is specific to a device or asset and is stored as a device/asset attribute.
-
Perimeter key name: This is the name of the metadata key that stores the perimeter information.
-
For Polygon perimeter type: The polygon definition is a string that contains an array of coordinates. The format for each coordinate is [latitude, longitude]. The array should be enclosed in double brackets and each coordinate should be separated by a comma. Example format: [[lat1, lon1],[lat2, lon2],[lat3, lon3], … , [latN, lonN]]
-
For Circle perimeter type: The circle perimeter is defined by its center point and its range. The center latitude and longitude are the coordinates of the center of the circle. The range is a double-precision floating-point value that specifies the radius of the circle. Range units can be specified as one of the following options: Meter, Kilometer, Foot, Mile, Nautical Mile.
If the “Fetch perimeter from message metadata” option is enabled and the “Perimeter key name” is not configured, the rule node will use default metadata key names. For the polygon perimeter type, the default metadata key name is “perimeter”. For the circle perimeter type, the default metadata key names are “centerLatitude”, “centerLongitude”, “range”, and “rangeUnit”.
The definition of the perimeter of a circle is stored as a server-side attribute, and its structure is determined by the specific implementation.
Available radius units: METER, KILOMETER, FOOT, MILE, NAUTICAL_MILE;
Output
Output connection types can be set as either “True” or “False”. The “Failure” connection will be utilized under two circumstances: a) If the incoming message does not contain a configured latitude or longitude key in its data or metadata, or b) if there is a missing perimeter definition.
Examples
Static circle perimeter
Suppose you want to verify if the device is within 100 meters of the Ukraine’s Independence Monument, situated in the center of Kyiv. The latitude and longitude coordinates of the monument are as follows: latitude = 50.4515652, longitude = 0.5236963. The setup for the rule node is straightforward:

Fig. 10.1 – Add gps geofencing filter – circle perimeter
Static polygon perimeter
Consider a basic scenario of monitoring the location of livestock. Configure the rule node to monitor whether the sheep is within the specified area perimeter:
We will use the static polygon coordinates of the farm field:
If you provide the following coordinates in the message, you can test whether the rule node returns ‘True’:
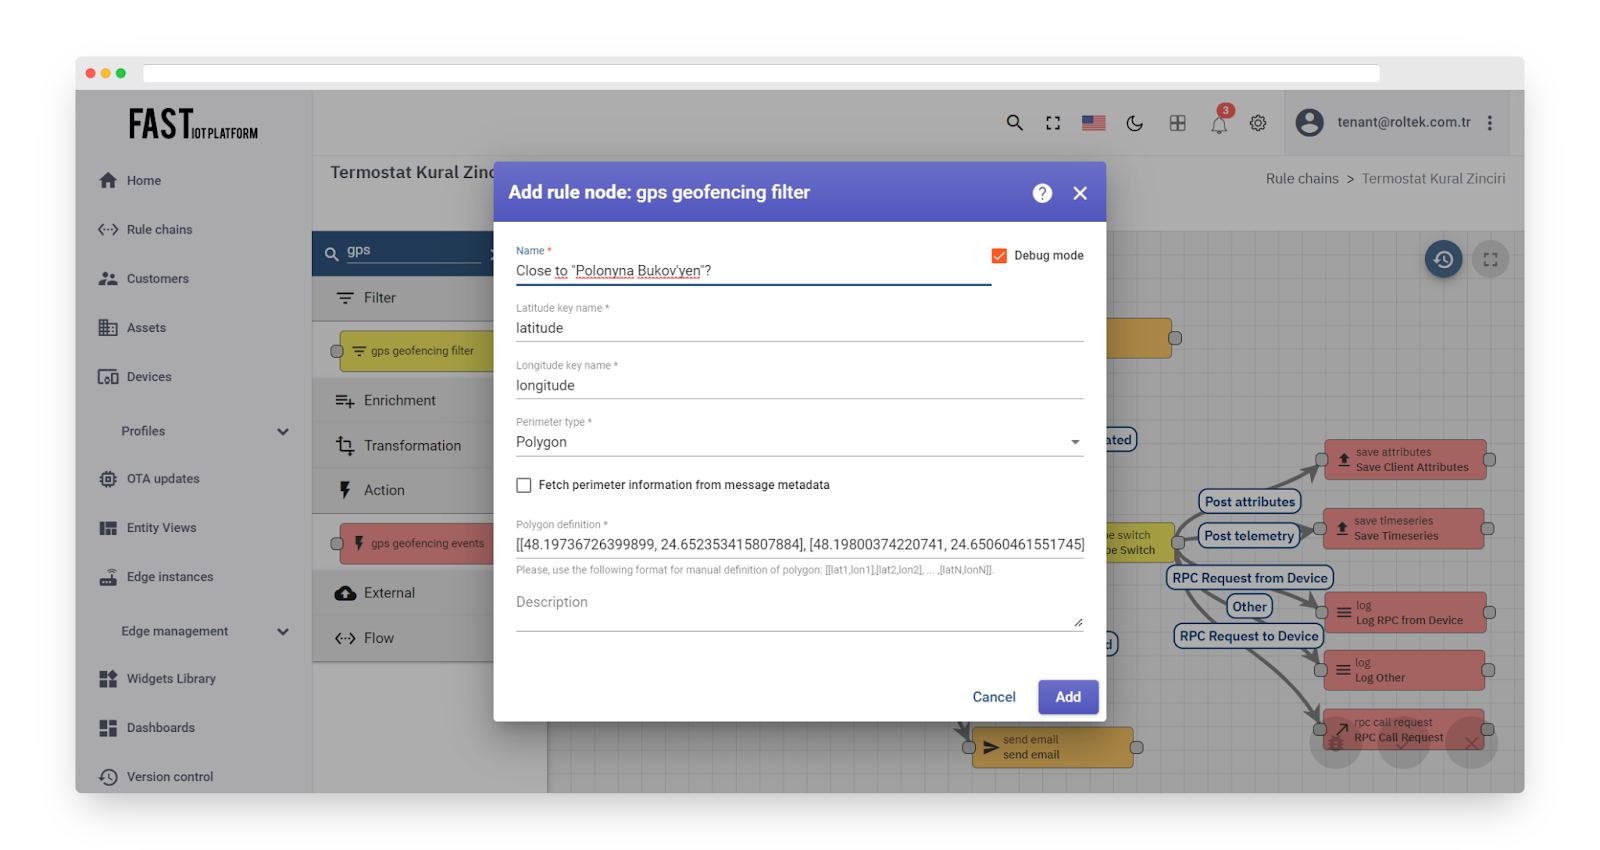
Fig. 10.2 – Add gps geofencing filter – polygon perimeter
Dynamic circle/polygon perimeter
Let’s take a look at a more intricate case of monitoring livestock locations, where sheep may be located in multiple farms. Suppose we have established two farms, namely Farm A and Farm B. Each device used for tracking livestock is associated with either Farm A or Farm B’s assets.
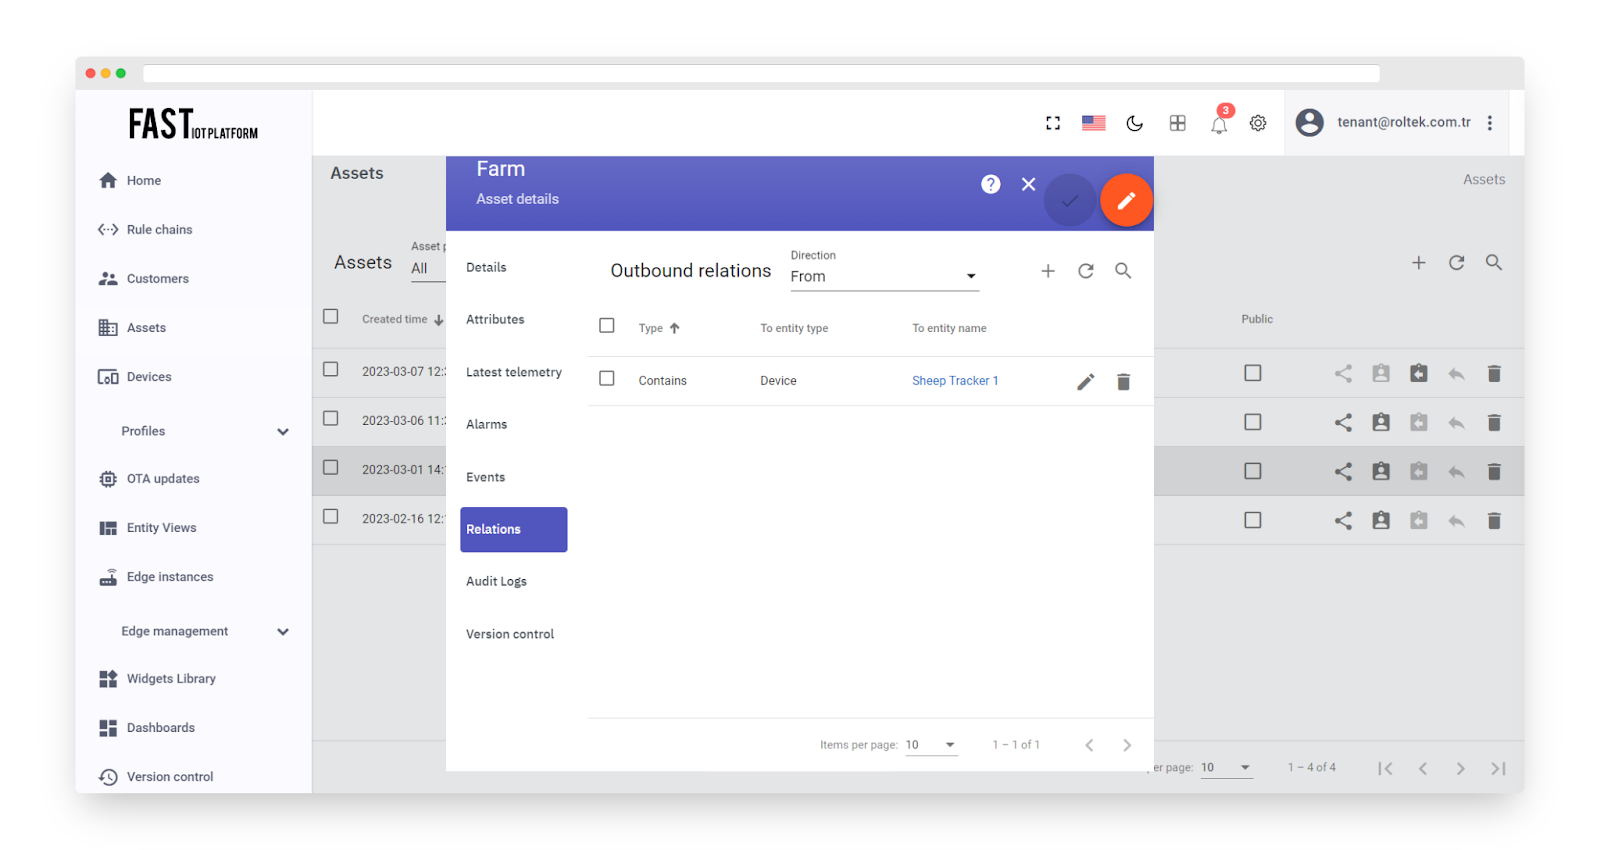
Fig. 10.3 – Each device used for tracking livestock is associated with either Farm A or Farm B’s assets.
We will configure server-side attribute called “perimeter” with the JSON value: “[[48.19736726399899, 24.652353415807884], [48.19800374220741, 24.65060461551745], [48.19918370897885, 24.65317953619048], [48.19849718616351, 24.65420950445969]]”;
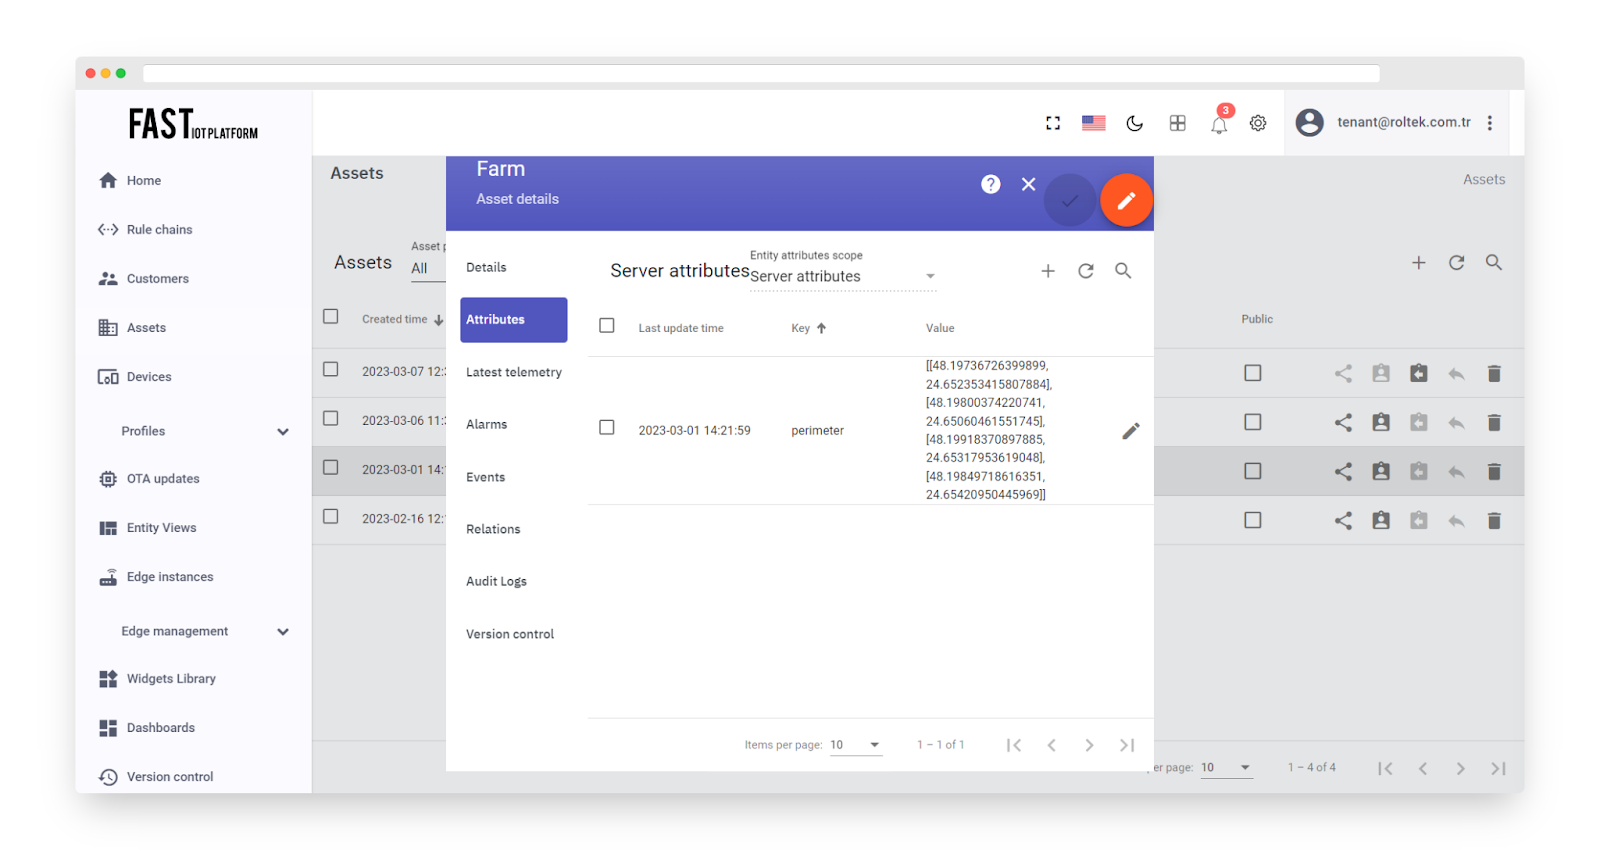
Fig. 10.4 – We will configure server-side attribute called “perimeter” with the JSON value.
The rule chain below will retrieve the attribute from the associated asset (Farm A) and employ it in the geofencing node:
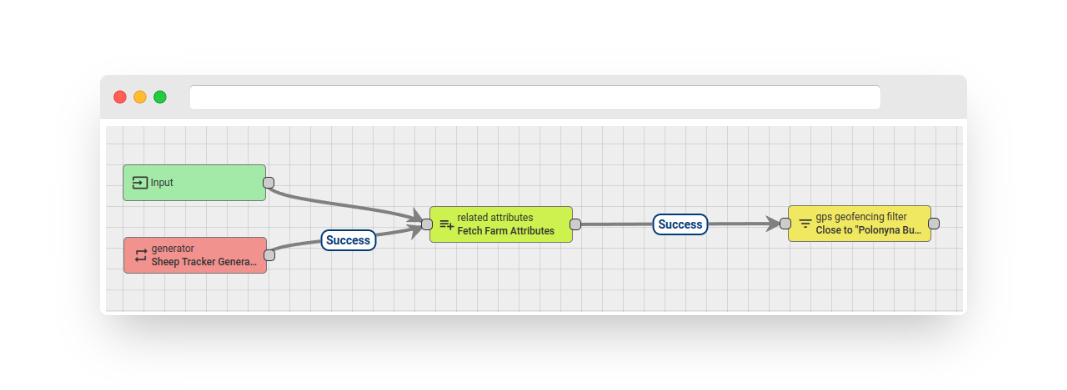
Fig. 10.5 – Rule chain: gps geofencing filter
The configuration of the rule node is quite straightforward. It should be noted that the key name for perimeter is without any prefix:
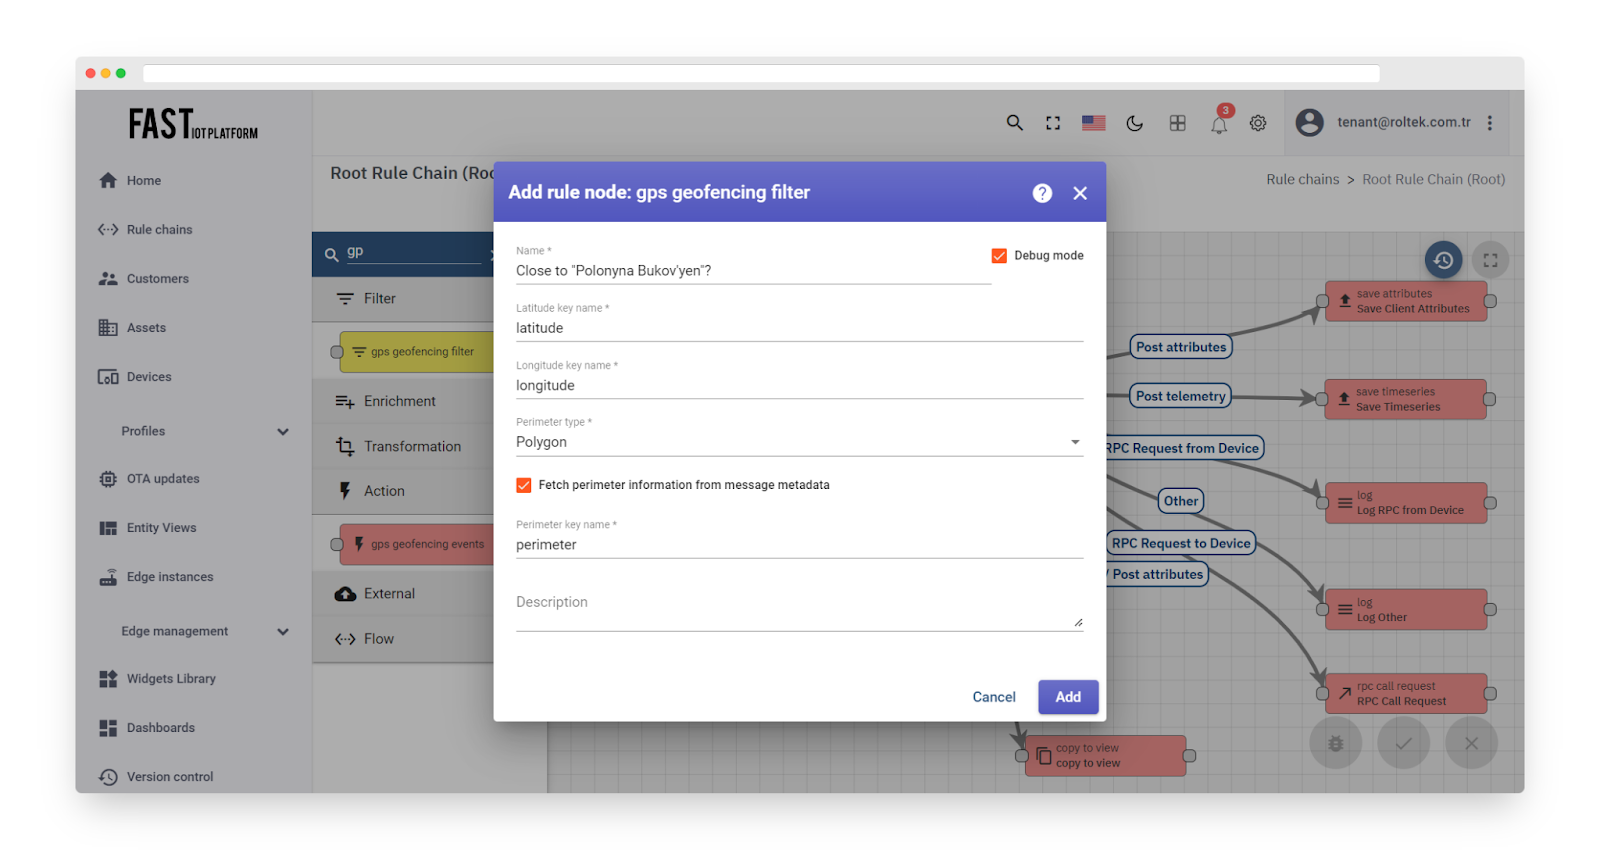
Fig. 10.6 – It should be noted that the key name for perimeter is without any prefix.
You can download and import the rule chain, but please note that the “rule chain” nodes will point to a non-existent device in the “Sheep Tracker Generator” node. To replicate the example, you will need to provision the device and asset.
Enrichment Nodes #
Enrichment nodes are utilized to update the metadata of incoming messages.
Calculate delta #
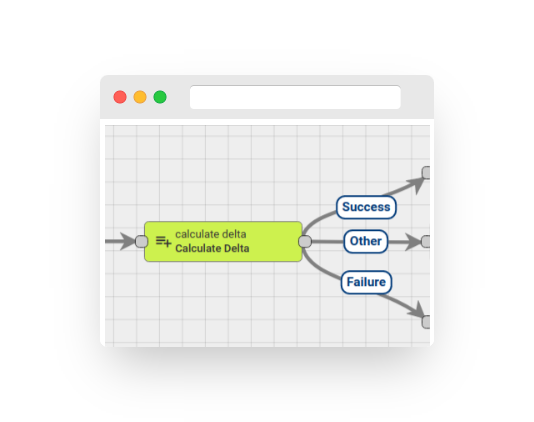
Fig. 1.1 – Rule node: Calculate delta
The process of calculating the ‘delta’ by comparing the previous and current readings of a time-series data, and appending it to the message is performed within the context of the message originator, such as a device, asset, or customer. This functionality is particularly useful for applications related to smart metering. For instance, if a water metering device reports the absolute value of the pulse counter only once a day, to determine the consumption for the current day, one needs to compare the values of the previous and current days.
Here are the configuration parameters:
Input value key (default: ‘pulseCounter’): specifies the key used for delta calculation.
Output value key (default: ‘delta’): specifies the key that will store the delta value in the enriched message.
Decimals: sets the precision for delta calculation.
Use cache for latest value (default: enabled): enables the caching of the latest values in memory.
Tell ‘Failure’ if delta is negative (default: enabled): forces message processing to fail if the delta value is negative.
Add period between messages (default: disabled): adds the value of the period between the current and previous messages.
Rule node relations:
The rule node generates a message with one of the following relations:
-
Success – if the key configured via the ‘Input value key’ parameter is present in the incoming message;
-
Other – if the key configured via the ‘Input value key’ parameter is not present in the incoming message;
-
Failure – if the ‘Tell ‘Failure’ if delta is negative’ option is enabled and the delta calculation returns a negative value;
Let’s examine the behavior of the rule node through an example. Let’s assume the following configuration:”
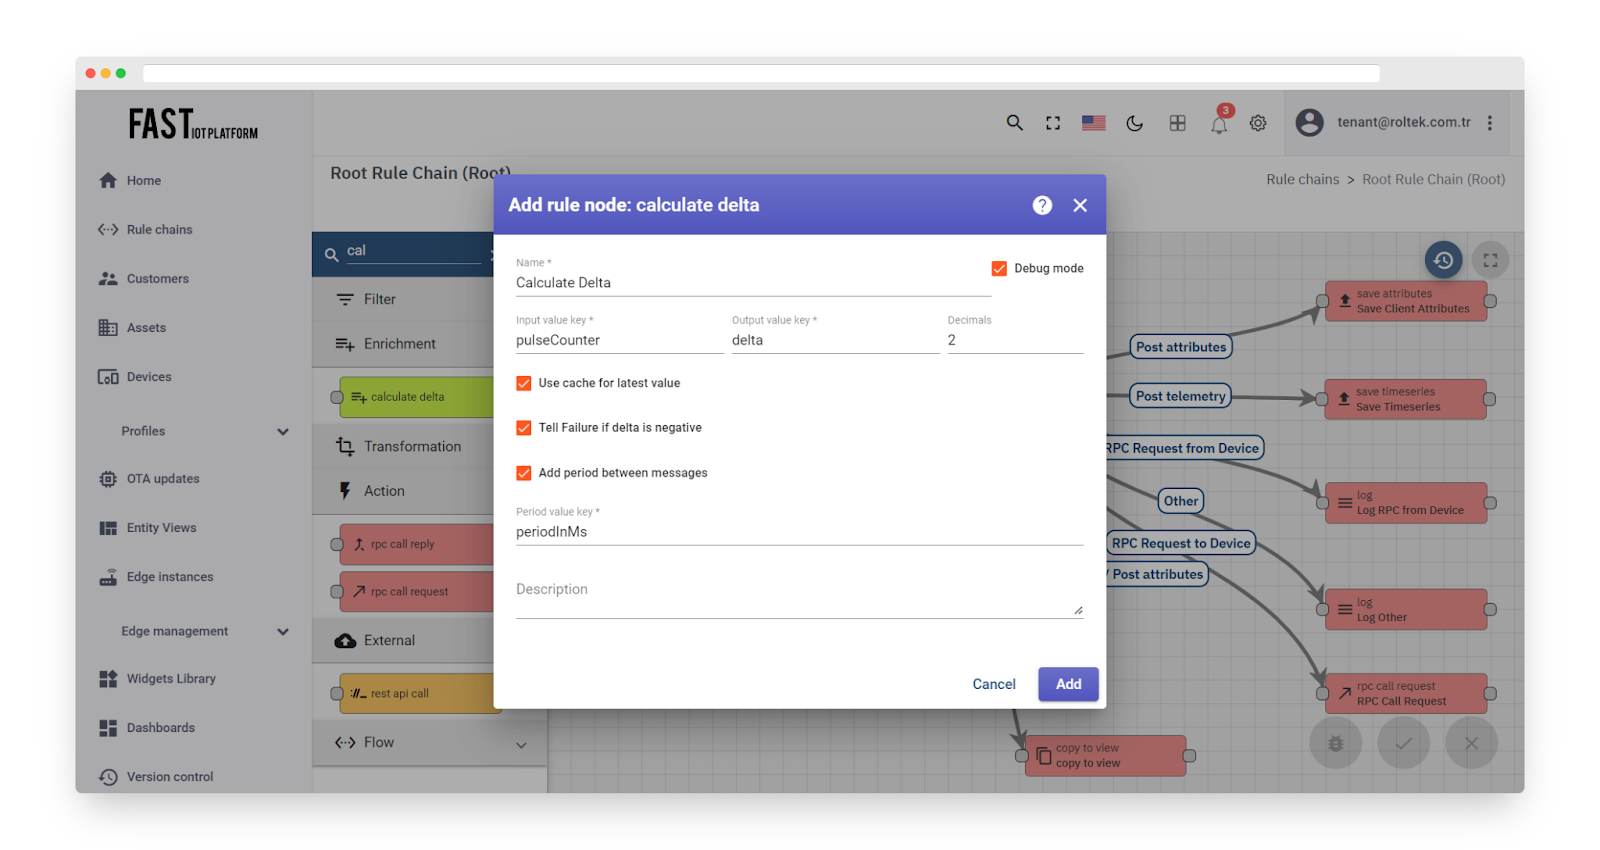
Fig. 1.2 – Add calculate delta
Let’s assume that the following messages are sent by the same device and arrive at the rule node in the order listed:
The output will be the following:
Customer attributes #
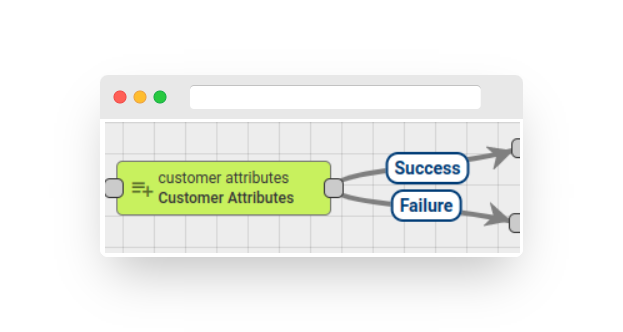
Fig. 2.1 – Rule node: customer attributes
The node searches for the customer entity of the message originator and adds the customer’s attributes or the latest telemetry value to the message metadata.
The administrator can configure the mapping between the original attribute name and the metadata attribute name.
The node configuration includes a ‘Latest Telemetry’ checkbox. If this checkbox is selected, the node will retrieve the latest telemetry for the configured keys. Otherwise, the node will retrieve the server scope attributes.
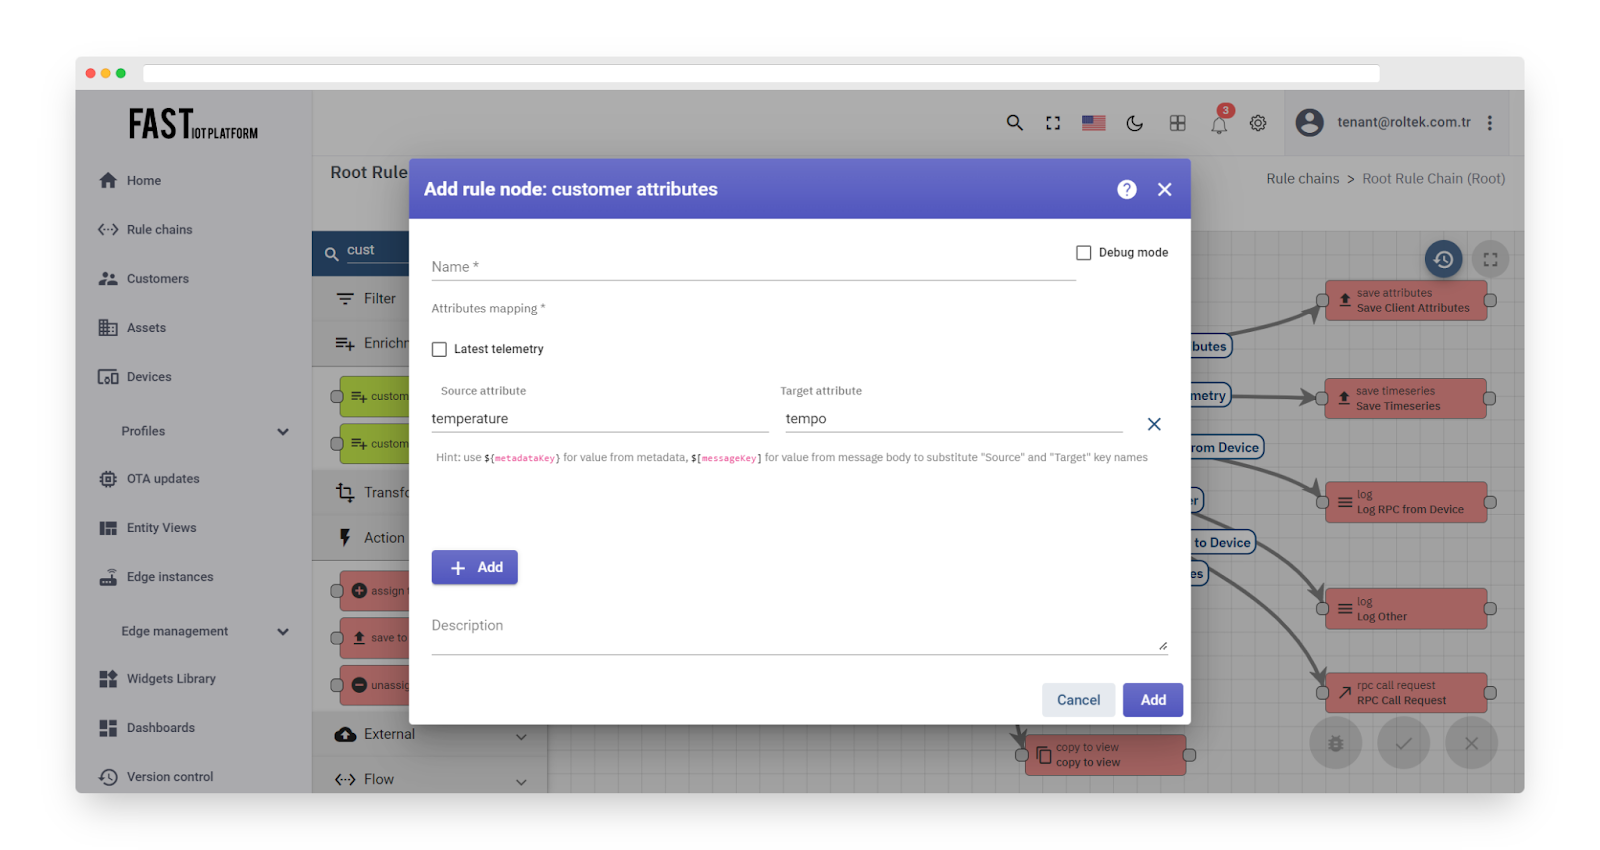
Fig. 2.2 – Add customer attributes.
If the configured attributes exist, they will be included in the outbound message metadata. To access the fetched attributes in other nodes, you can use the template ‘metadata.temperature’.
The following message originator types are allowed: customer, user, asset, and device. If an unsupported originator type is found, an error will be thrown.
If the originator does not have an assigned customer entity, the failure chain is used; otherwise, the success chain is used.
Note: You can use ${metadataKey} to retrieve a value from metadata and $[messageKey] to retrieve a value from the message body.
Example: Suppose you have the following metadata: {“country”: “England”}. Additionally, you have an attribute with a key that is a country name and a value that is a capital city ({“England”: “London”}).
The aim is to retrieve the capital city from the attribute for the country from the metadata and add the result to the metadata with the key “city”. To achieve this, you can use ${country} as the source attribute and “city” as the target attribute.
The result would be {“city”: “London”}.”
Device attributes #
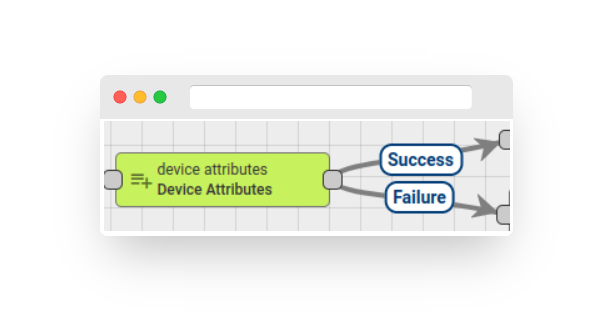
Fig. 3.1 – Rule node: device attributes
The node searches for the related device entity of the message originator using the configured query and adds the attributes (client/shared/server scope) and latest telemetry value to the message metadata.
Attributes are added into metadata with scope prefix:
-
shared attribute -> shared_
-
client attribute -> cs_
-
server attribute -> ss_
-
telemetry -> no prefix used
Örneğin, paylaşılan öznitelik ‘version’, ‘shared_version’ adıyla Metadata’ya eklenecektir. İstemci öznitelikleri ‘cs_’ ön eki kullanacak. Sunucu öznitelikleri ‘ss_’ ön eki kullanacak. Son telemetri değeri, ön ek kullanılmadan Mesaj Metadata’sına eklenir.
‘Cihaz ilişkisi sorgusu’ yapılandırmasında yönetici gerekli Yönlendirme ve ilişki derinlik seviyesini seçebilir. Ayrıca İlişki türü, gereksinim duyulan Cihaz türleri kümesiyle yapılandırılabilir.
If multiple related entities are found, only the first entity is used for attribute enrichment, and the other entities will be discarded.
If no related entity is found, the failure chain is used; otherwise, the success chain is used.
If an attribute or telemetry is not found, it will not be added to the message metadata and will still be routed via the success chain.
The outbound message metadata will only contain configured attributes if they exist.
To access the fetched attributes in other nodes, you can use the template ‘metadata.temperature’.
Note: The Rule Node has the ability to enable/disable reporting failures if at least one selected key does not exist in the outbound message.
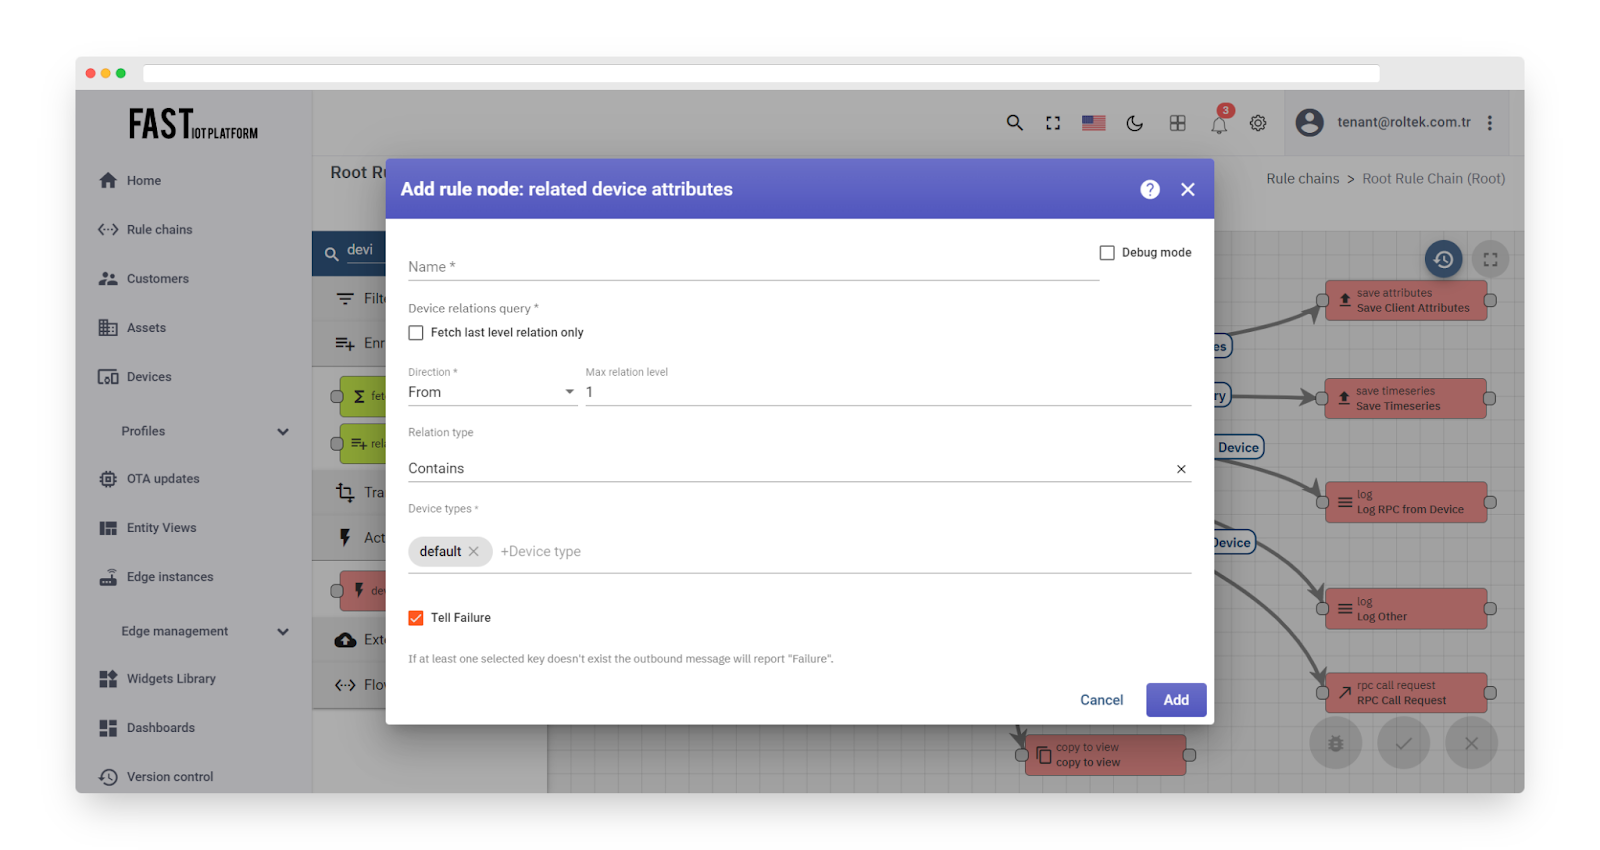
Fig. 3.2 – Add device attributes (1)
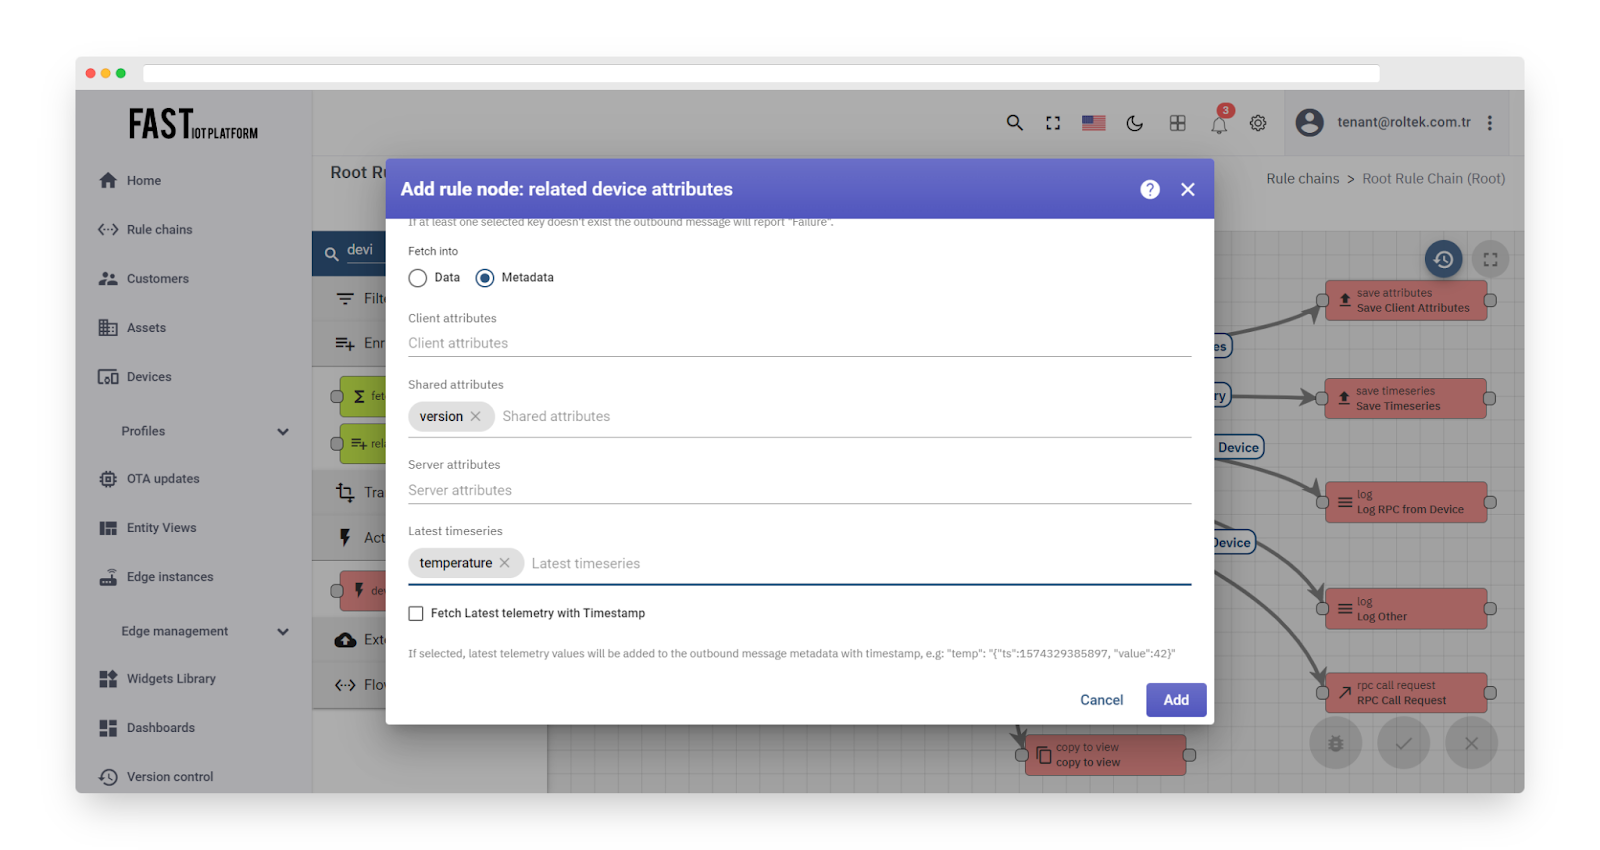
Fig. 3.3 – Add device attributes (2)
Originator attributes #

Fig. 4.1 – Rule node: originator attributes
The node adds message originator attributes (client/shared/server scope) and the latest telemetry value to the message metadata.
The attributes are added to the metadata with a scope prefix as follows:
-
shared attribute -> shared_
-
client attribute -> cs_
-
server attribute -> ss_
-
telemetry -> no prefix used
As an example, a shared attribute named ‘version’ will be added to the metadata with the name ‘shared_version’. Client attributes will use the ‘cs_’ prefix, while server attributes will use the ‘ss_’ prefix. The latest telemetry value is added to the message metadata as is, without a prefix.
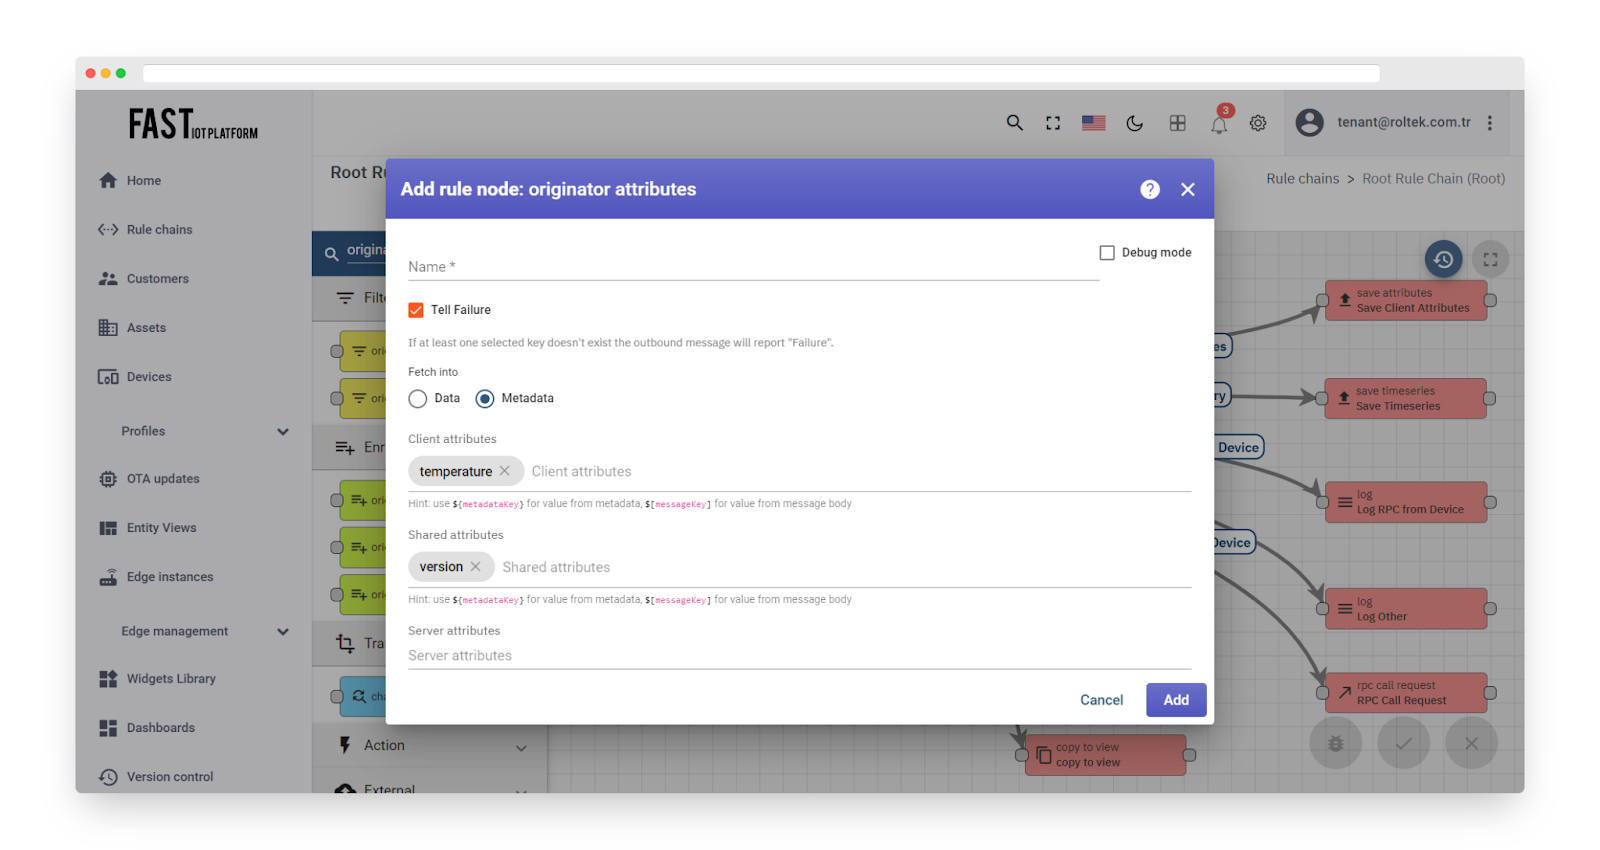
Fig. 4.2 – Add originator attributes
If the configured attributes exist, the outbound message metadata will contain them.
To access the fetched attributes in other nodes, you can use the template ‘metadata.cs_temperature’.
Note: The Rule Node has the ability to enable/disable reporting failures if at least one selected key does not exist in the outbound message.
Originator fields #
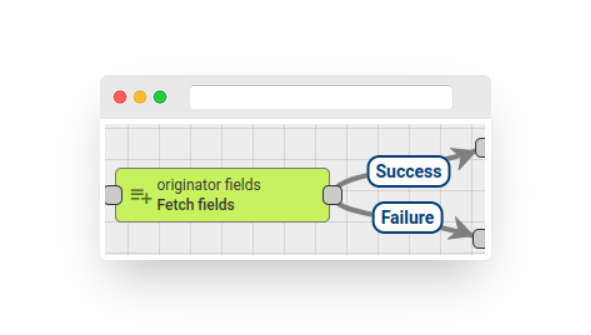
Fig. 5.1 – Rule node: originator fields
The node fetches the field values of the message originator entity and adds them to the message metadata. The administrator can configure the mapping between the field name and the metadata attribute name. If a specified field is not part of the message originator entity fields, it will be ignored.
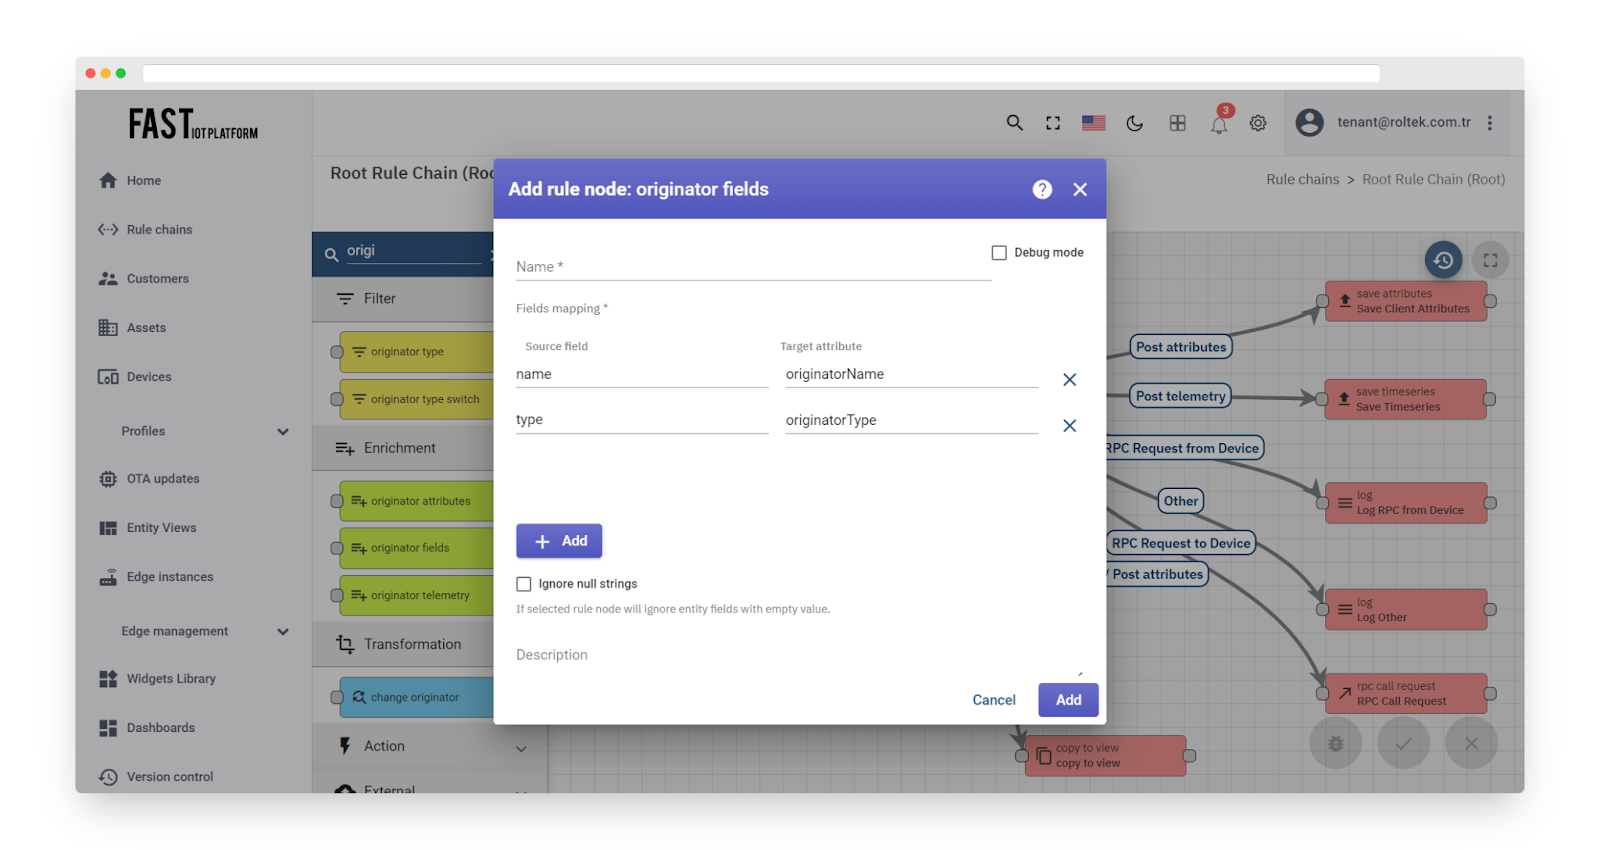
Fig. 5.2 – Add originator fields
The following message originator types are allowed: Tenant, Customer, User, Asset, Device, Alarm, Rule Chain.
If an unsupported originator type is found, the failure chain is used; otherwise, the success chain is used.
If a field value is not found, it is not added to the message metadata and will still be routed via the success chain.
The outbound message metadata will only contain configured attributes if they exist.
To access fetched attributes in other nodes, you can use the template ‘metadata.devType’.
Related attributes #
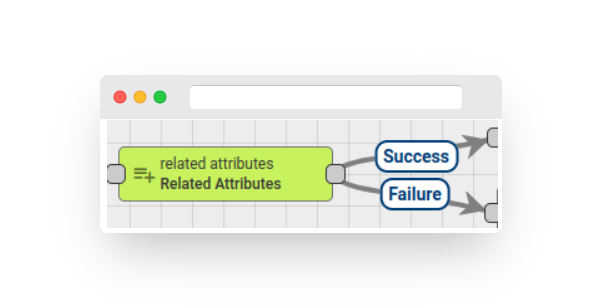
Fig. 6.1 – Rule node: related attributes
The node finds the related entity of the message originator entity using the configured query and adds attributes or the latest telemetry value to the message metadata.
The administrator can configure the mapping between the original attribute name and the metadata attribute name.
In the ‘Relations query’ configuration, the administrator can select the required direction and relation depth level. A set of relation filters can also be configured with the required relation type and entity types.
There is a ‘Latest Telemetry’ checkbox in the node configuration. If this checkbox is selected, the node will fetch the latest telemetry for the configured keys. Otherwise, the node will fetch server scope attributes.
If multiple related entities are found, only the first entity is used for attribute enrichment, and the other entities are discarded.
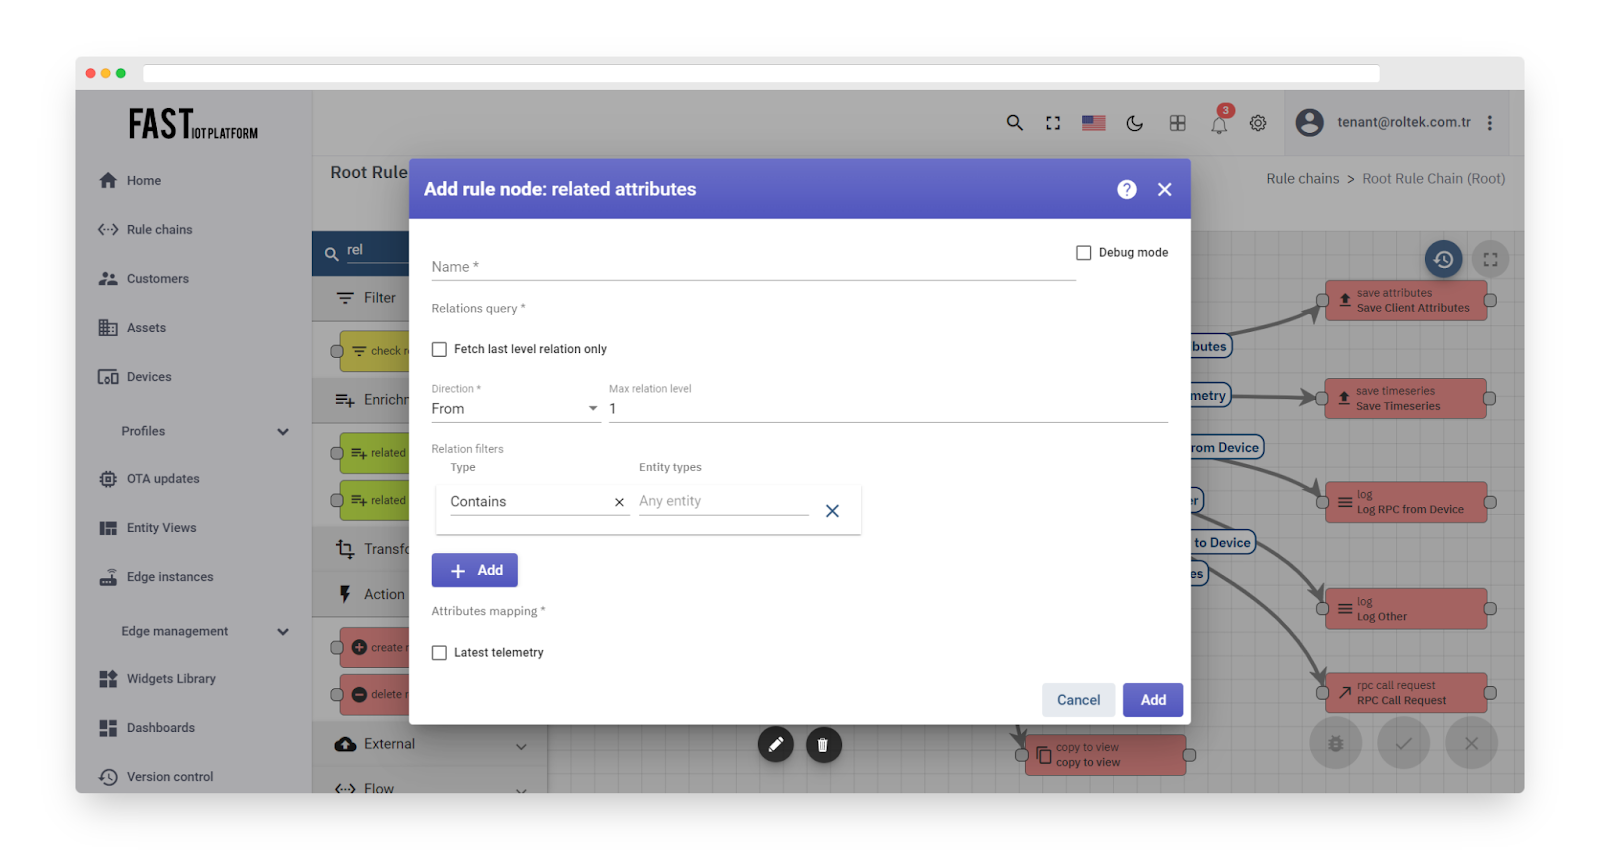
Fig. 6.2 – Add related attributes
If no related entity is found, the failure chain is used; otherwise, the success chain is used.
The outbound message metadata will contain configured attributes if they exist.
To access fetched attributes in other nodes, you can use the template ‘metadata.tempo’.
Note: Since TB Version 3.3.3, you can use ‘${metadataKey}’ for a value from metadata and ‘$[messageKey]’ for a value from the message body.
An example of this feature can be seen in the description for the Customer Attributes node.
Tenant attributes #
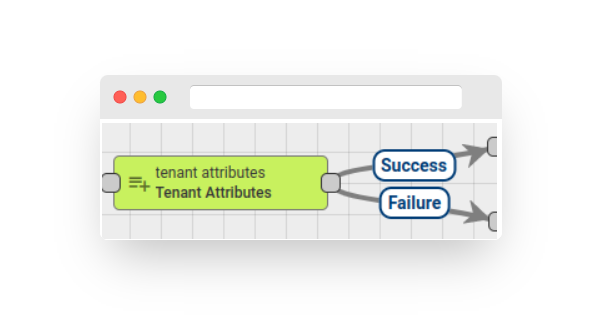
Fig. 7.1 – Rule node: tenant attributes
The Node identifies the Tenant of the entity that originated the message and incorporates the Tenant Attributes or the latest telemetry value into the Message Metadata.
The Administrator has the ability to customize the correlation between the original attribute name and the corresponding Metadata attribute name.
The Node configuration includes a checkbox labeled “Latest Telemetry.” If this option is enabled, the Node will retrieve the most up-to-date telemetry data for the specified keys. If the checkbox is not selected, the Node will retrieve attributes scoped to the server.
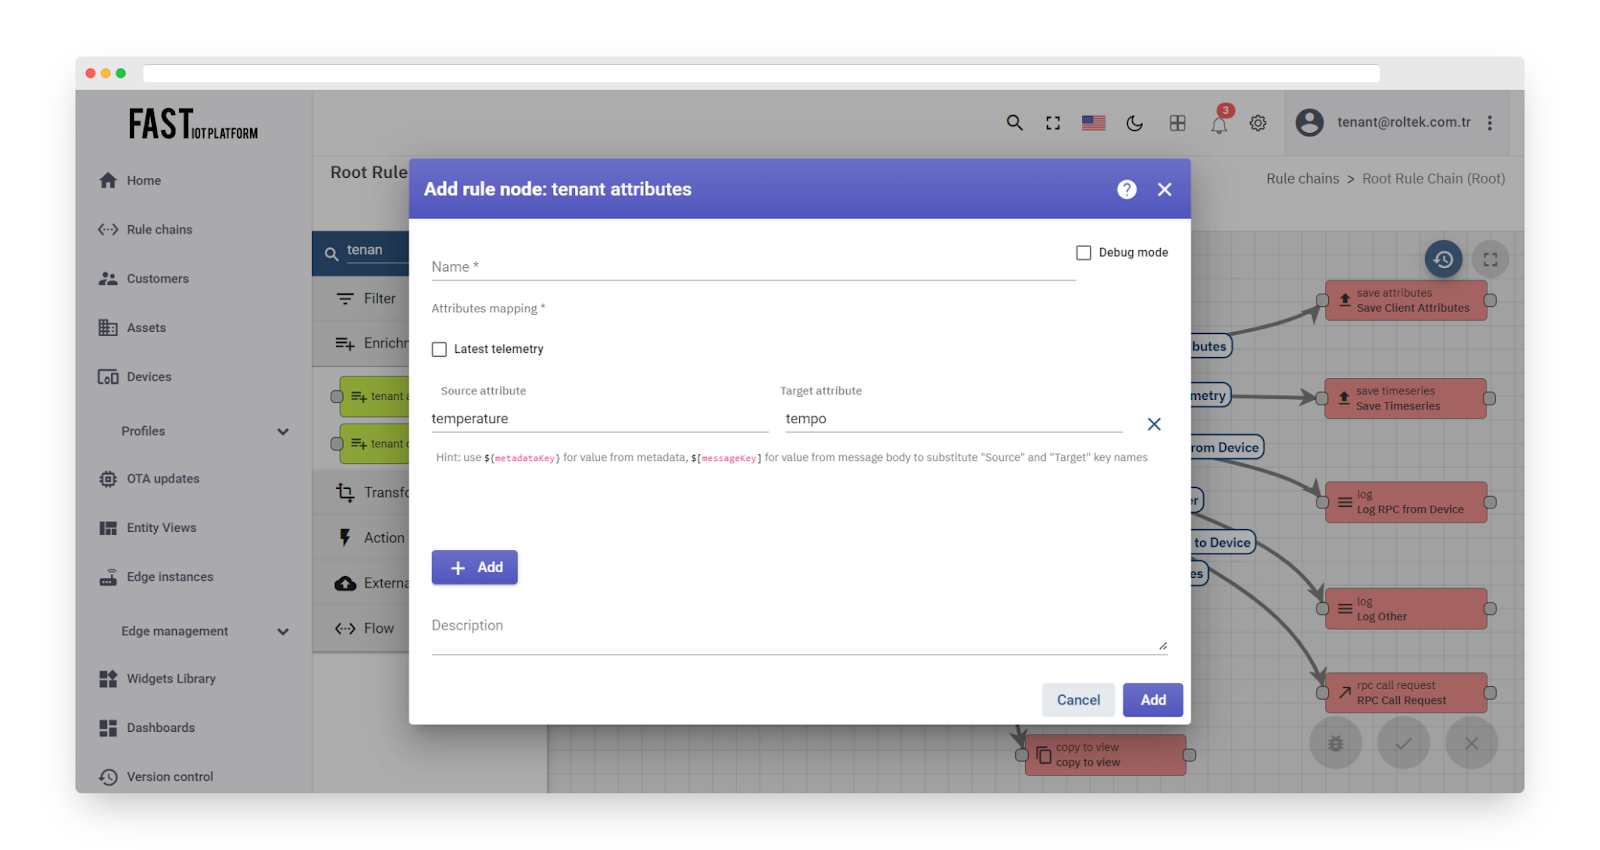
Fig. 7.2 – Add tenant attributes
If configured attributes exist, the Outbound Message Metadata will include them. To access retrieved attributes in other nodes, you can use the ‘metadata.tempo’ template.
The Message Originator can be one of the following types: Tenant, Customer, User, Asset, Device, Alarm, Rule Chain. If an unsupported Originator type is detected, an error will be generated.
If the Originator has no assigned Tenant Entity, the Failure chain will be used; otherwise, the Success chain will be used.
Note: Starting from TB Version 3.3.3, you can use ${metadataKey} to retrieve a value from metadata and $[messageKey] to retrieve a value from the message body.
An example of this feature can be found in the description for the Customer attributes node.
Originator telemetry #
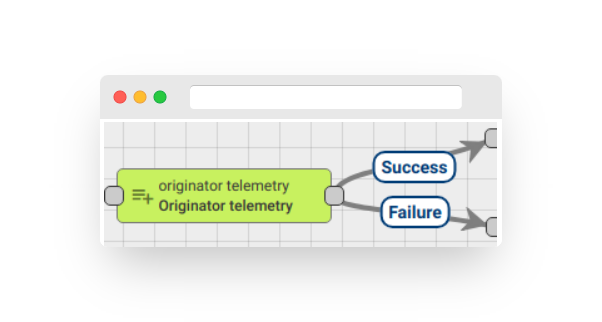
Fig. 8.1 – Rule node: originator telemetry
The Node adds the telemetry values of the Message Originator from a specific time range, which was selected in the node configuration, to the Message Metadata.
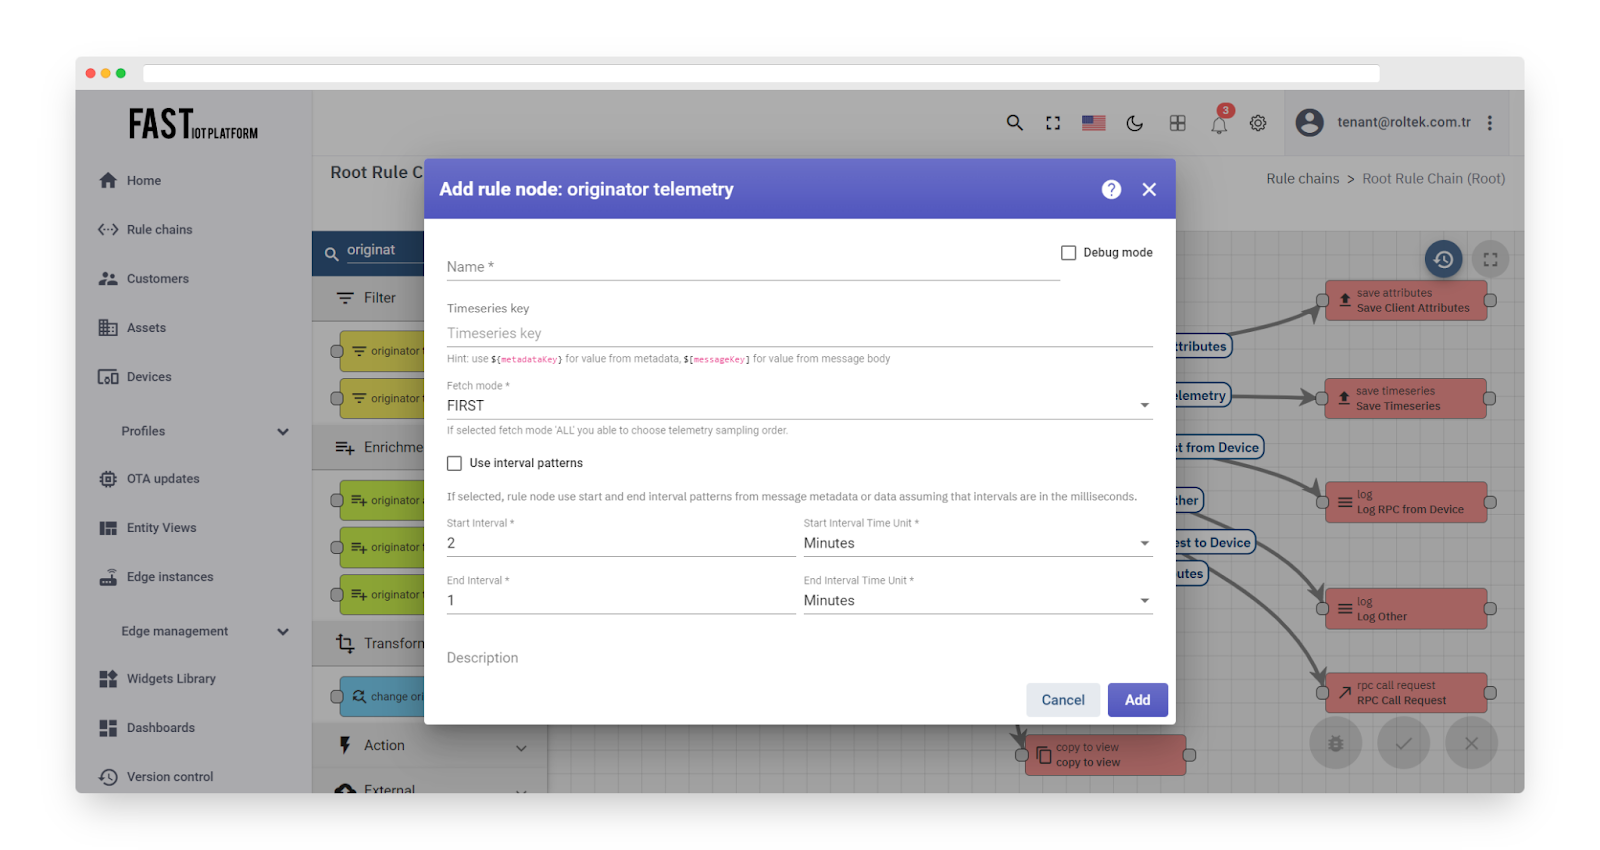
Fig. 8.2 – Add originator telemetry
Telemetry values are added to Message Metadata without a prefix.
The rule node has three fetch modes:
-
FIRST: retrieves telemetry from the database that is closest to the beginning of the time range.
-
LAST: retrieves telemetry from the database that is closest to the end of the time range.
-
ALL: retrieves all telemetry from the database that falls within the specified time range.
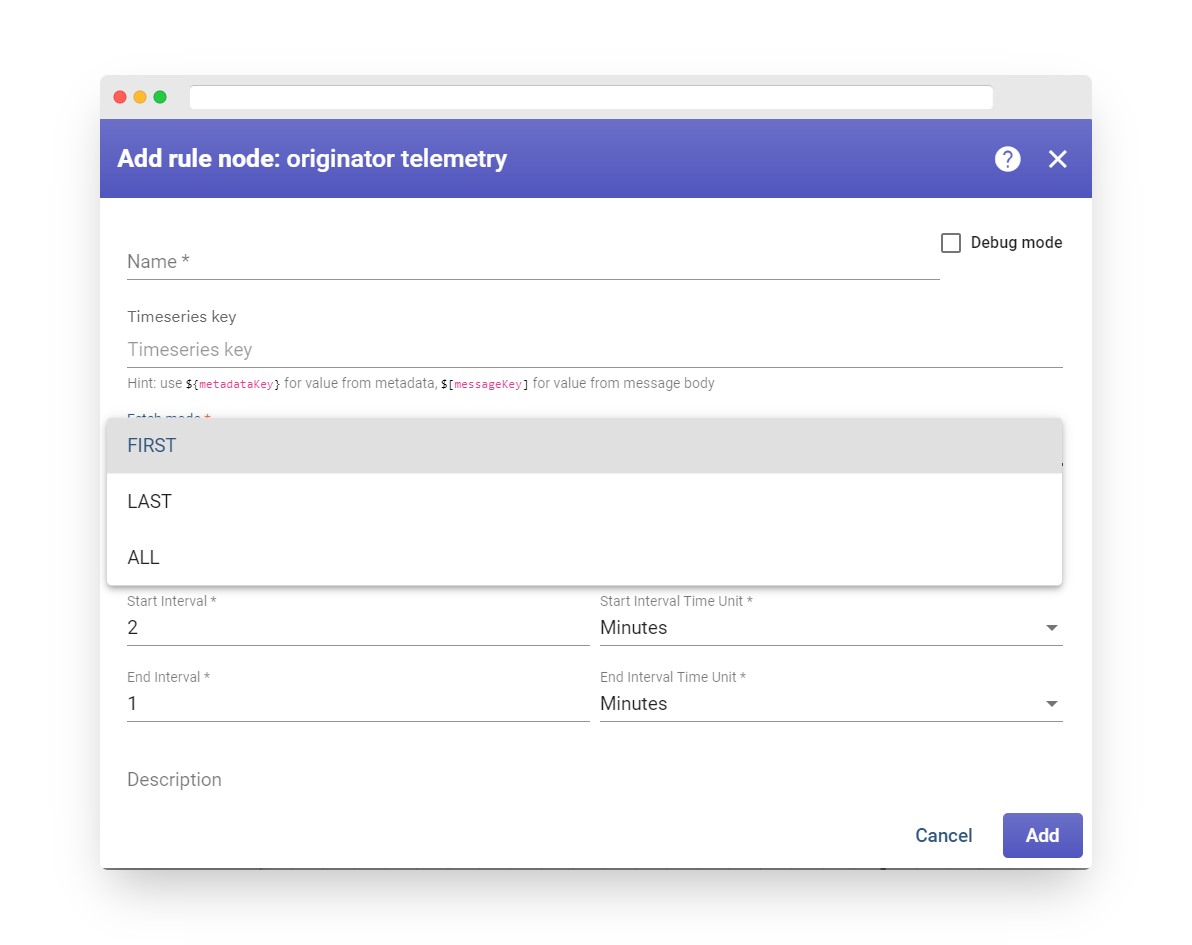
Fig. 8.3 – The rule node has three fetch modes.
If the fetch mode FIRST or LAST is selected, the Outbound Message Metadata will contain JSON elements in the form of key/value pairs.
Alternatively, if the fetch mode ALL is selected, the telemetry data will be fetched as an array.
Note: The rule node is capable of extracting a limited number of records, up to 1000, into an array.
The resulting array will consist of JSON objects with the timestamp and corresponding values.
Note: The end of the time interval must always be greater than the beginning of the interval.
If the ‘Use metadata interval patterns’ checkbox is selected, the rule node will utilize the Start Interval and End Interval patterns from the metadata.
The units of these patterns are in milliseconds since the UNIX epoch (January 1, 1970 00:00:00 UTC).
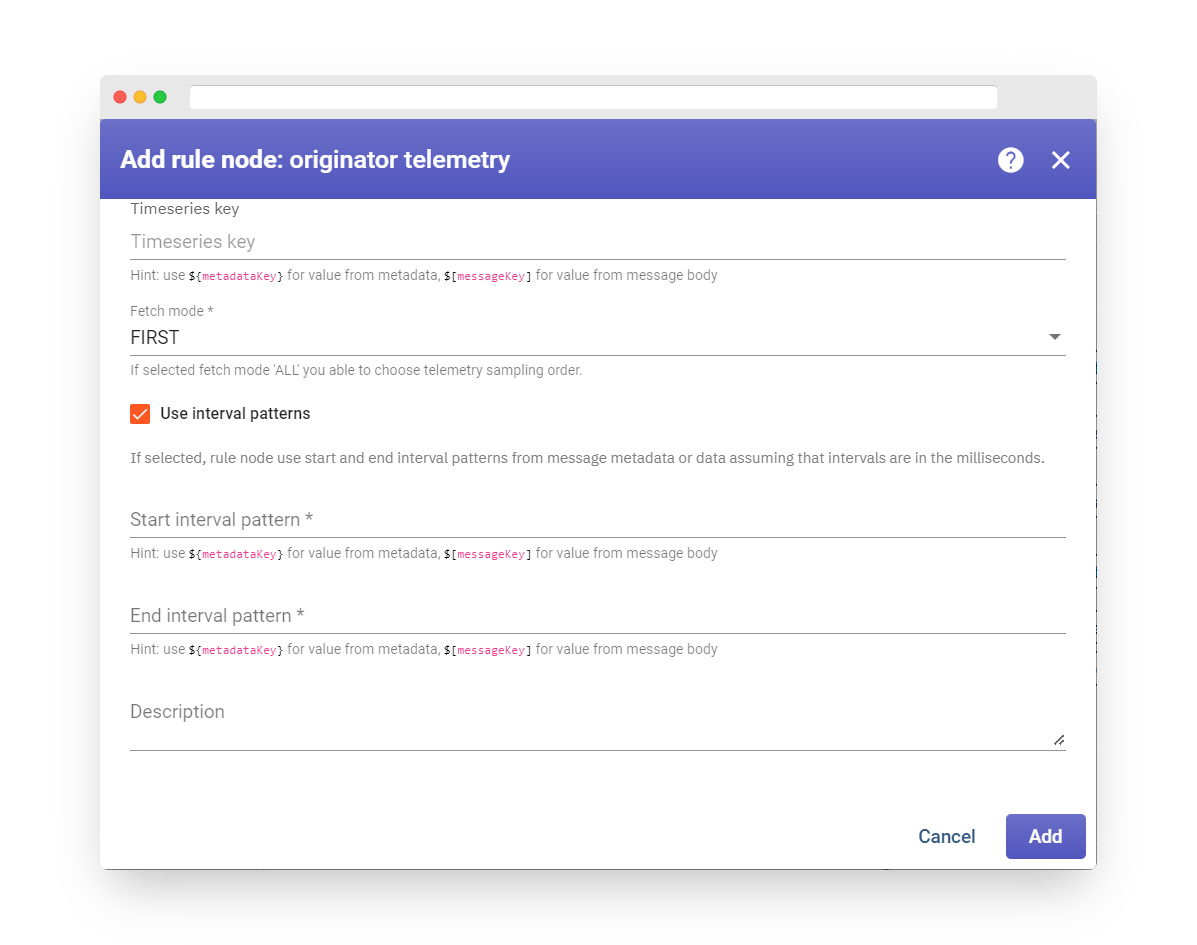
Fig. 8.4 – If the ‘Use metadata interval patterns’ checkbox is selected, the rule node will utilize the Start Interval and End Interval patterns from the metadata.
-
If any pattern is missing from the Message metadata, the outbound message will be routed via the failure chain.
-
Additionally, if any pattern has an invalid data type, the outbound message will also be routed via the failure chain.
If the configured telemetry fields exist and belong to the selected range, the outbound message metadata will contain them.
If an attribute or telemetry value is not found, it will not be added to the Message Metadata and will still be routed via the Success chain.
To access the fetched telemetry in other nodes, you can use this template: JSON.parse(metadata.temperature).
Note: The rule node has the capability to choose the telemetry sampling order when the Fetch mode is set to ALL.
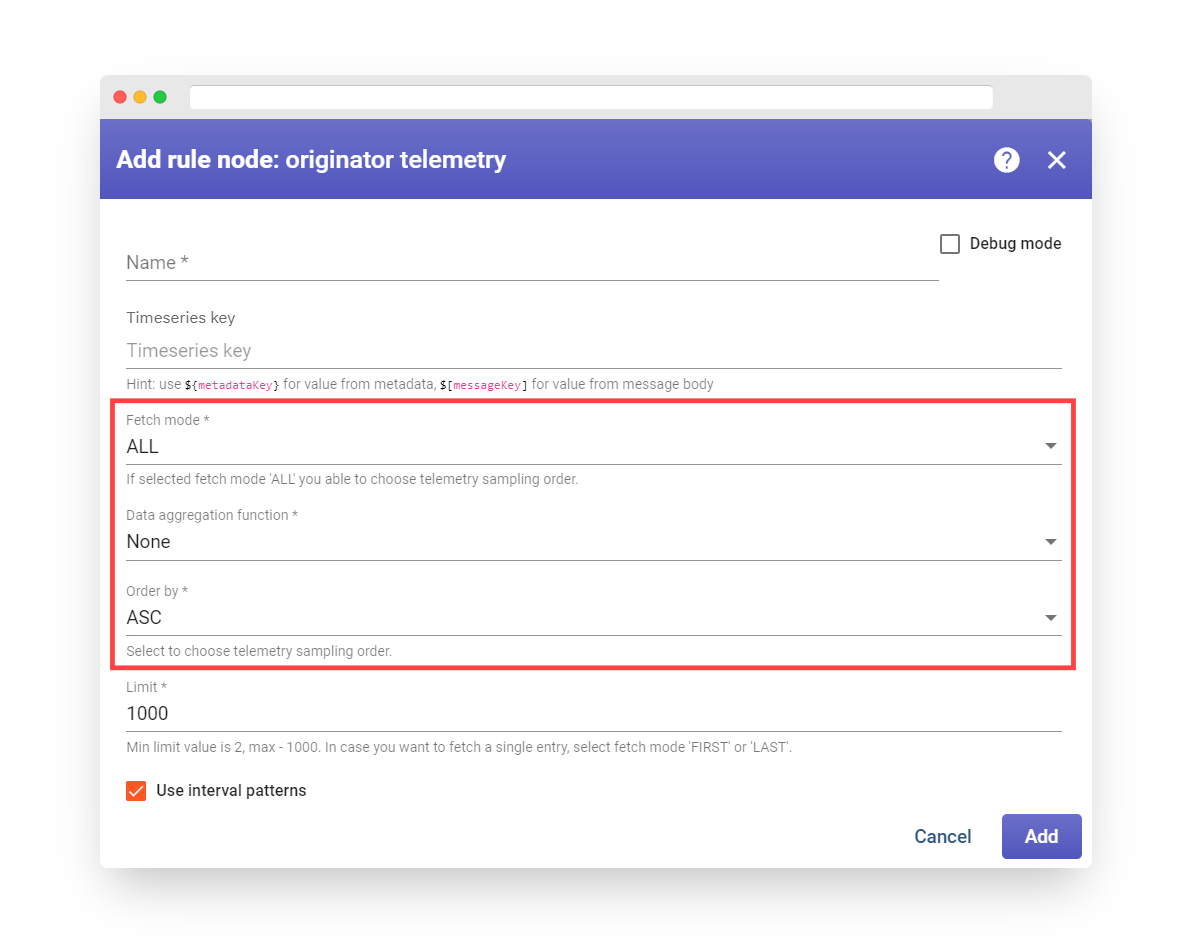
Fig. 8.5 – The rule node has the capability to choose the telemetry sampling order when the Fetch mode is set to ALL.
Tenant details #
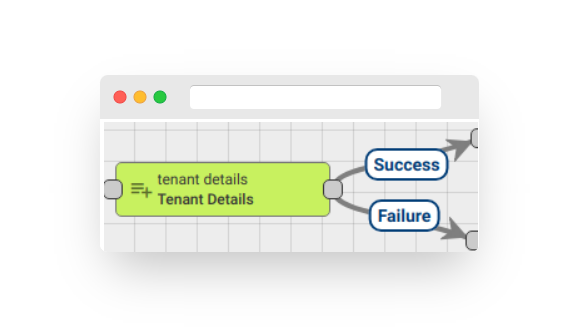
Fig. 9.1 – Rule node: tenant details
The Rule Node adds fields from the Tenant details to either the message body or metadata.
In the Node configuration, there is a checkbox labeled ‘Add selected details to the message metadata.’ If this checkbox is selected, the existing fields will be added to the message metadata instead of the message data.

Fig. 9.2 – Add tenant details
The selected details are added to the metadata with the prefix ‘tenant_‘. The outbound message will contain the configured details if they exist.
To access the fetched details in other nodes, you can use one of the following templates:
-
metadata.tenant_address
-
msg.tenant_address
If the Originator does not have an assigned Tenant Entity, the Failure chain is used. Otherwise, the Success chain is used.
Customer details #
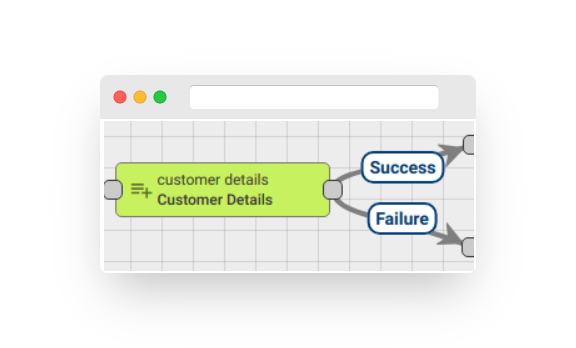
Fig. 10.1 – Rule node: customer details
The Rule Node adds fields from the Customer details to either the message body or metadata.
In the Node configuration, there is a checkbox labeled ‘Add selected details to the message metadata.’ If this checkbox is selected, the existing fields will be added to the message metadata instead of the message data.
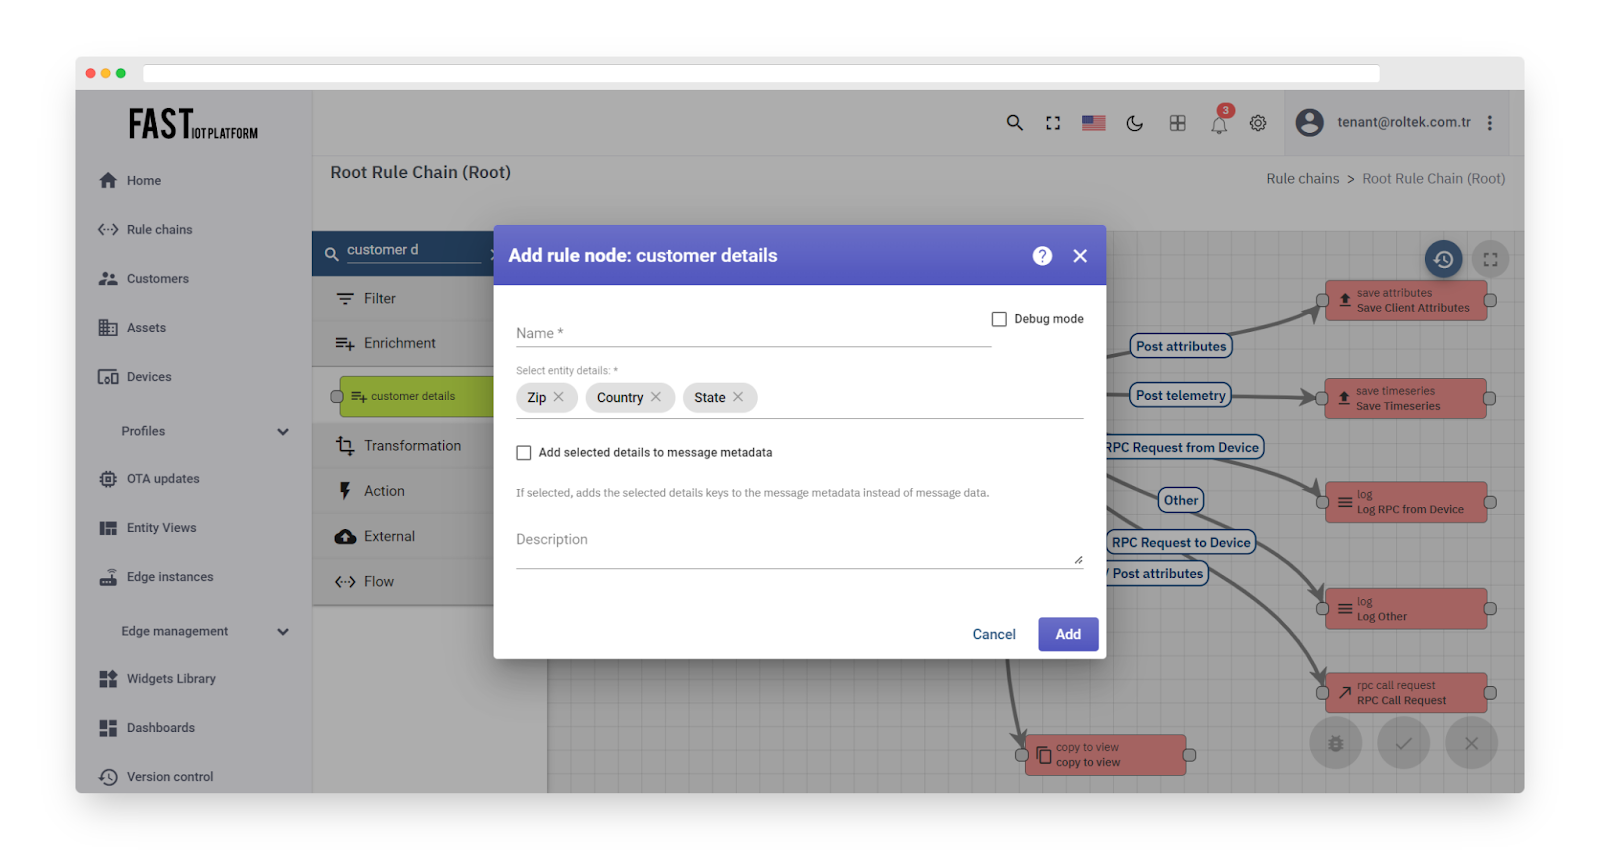
Fig. 10.2 – Add customer details
The selected details are added to the metadata with the prefix ‘customer_‘. The outbound message will contain the configured details if they exist.
To access the fetched details in other nodes, you can use one of the following templates:
-
metadata.customer_email
-
msg.customer_email
The following Message Originator types are allowed: Asset, Device, Entity View. If an unsupported Originator type is found, an error is thrown.
If the Originator does not have an assigned Customer Entity, the Failure chain is used. Otherwise, the Success chain is used.
https://Fast IoT Platform.io/docs/user-guide/rule-engine-2-0/transformation-nodes/
Transformation Nodes #
Transformation Nodes are utilized to modify incoming Message fields such as Originator, Message Type, Payload, and Metadata.
Change originator #
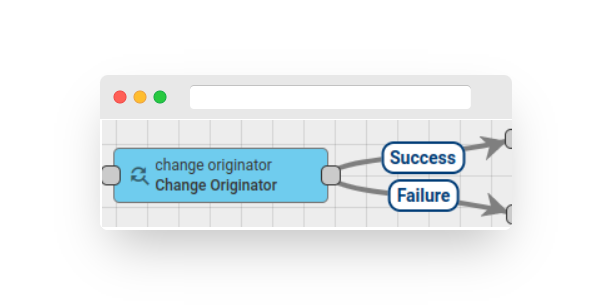
Fig. 1.1 – Rule node: change originator
All incoming Messages in Fast IoT Platform have an originator field that identifies the entity that submits the Message. It could be a Device, Asset, Customer, Tenant, and so on.
This node is used in cases where a submitted Message should be processed as a Message from another entity. For example, a Device submits telemetry and the telemetry should be copied into a higher level Asset or to a Customer. In this case, the Administrator should add this node before the Save Timeseries Node.
The originator can be changed to:
-
Originator’s Customer
-
Originator’s Tenant
-
Related Entity that is identified by Relations Query
In the ‘Relations query’ configuration, the Administrator can select the required Direction and relation depth level. A set of Relation filters can also be configured with the required Relation type and Entity Types.
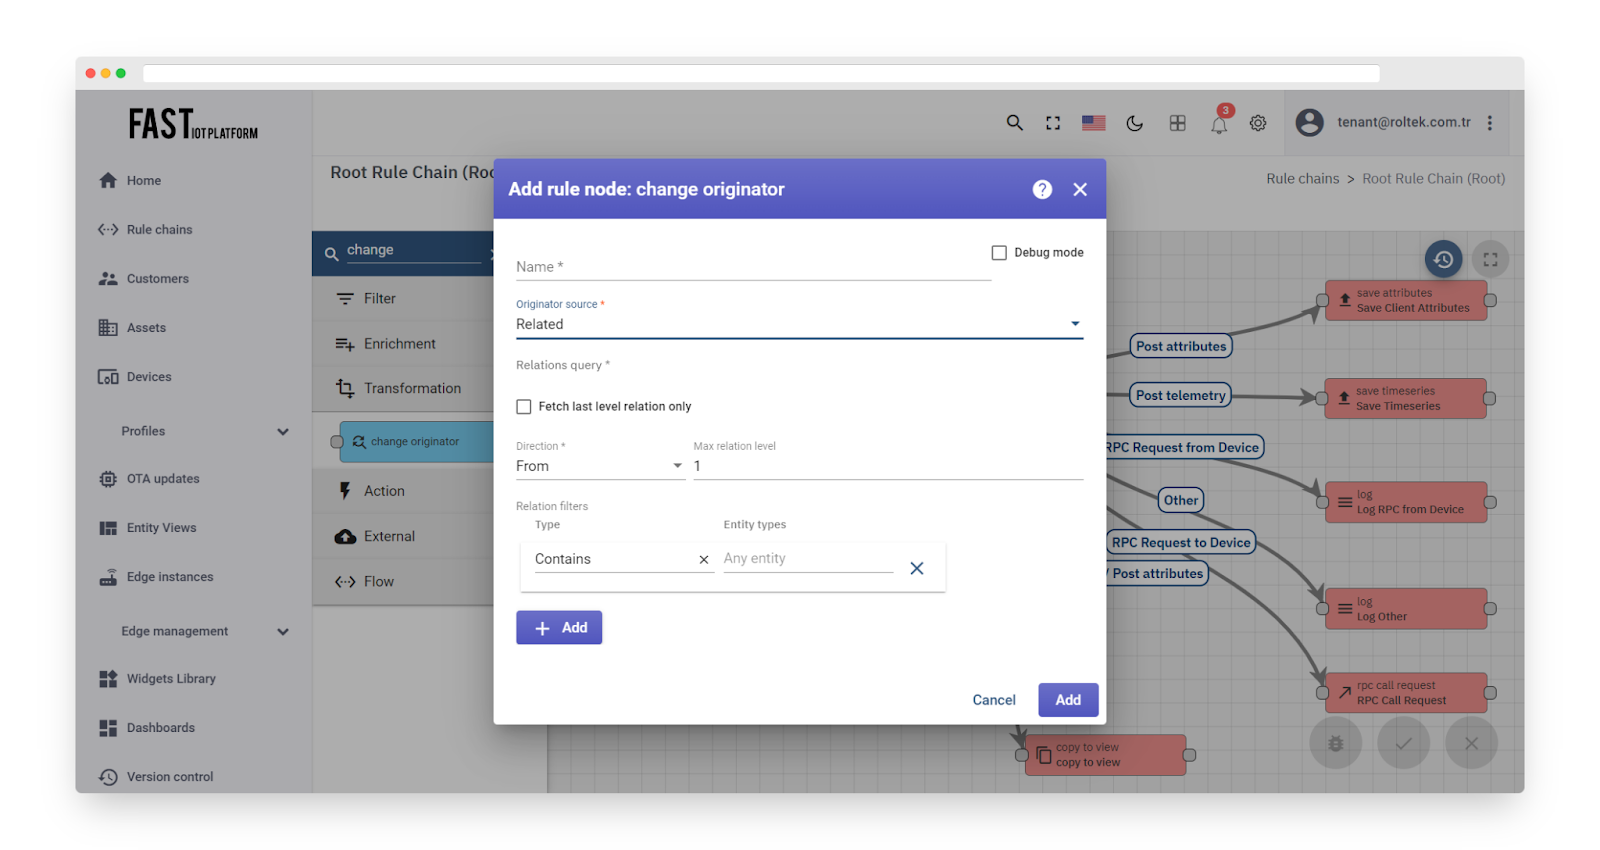
Fig. 1.2 – Add change originator
If multiple Related Entities are found, only the first Entity is used as the new originator, and the other entities are discarded.
The Failure chain is used if no Related Entity/Customer/Tenant was found; otherwise, the Success chain is used.
The outbound Message will have a new originator ID.
Script Transformation Node #
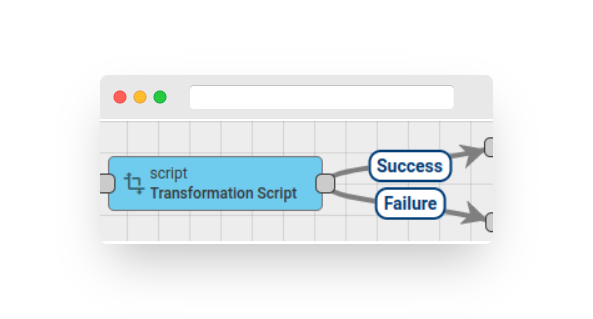
Fig. 2.1 – Rule node: Transformation script
This Node modifies the Message payload, Metadata, or Message type using a configured JavaScript function.
The JavaScript function receives 3 input parameters:
-
msg – the Message payload
-
metadata – the Message metadata
-
msgType – the Message type
The script should return the following structure:
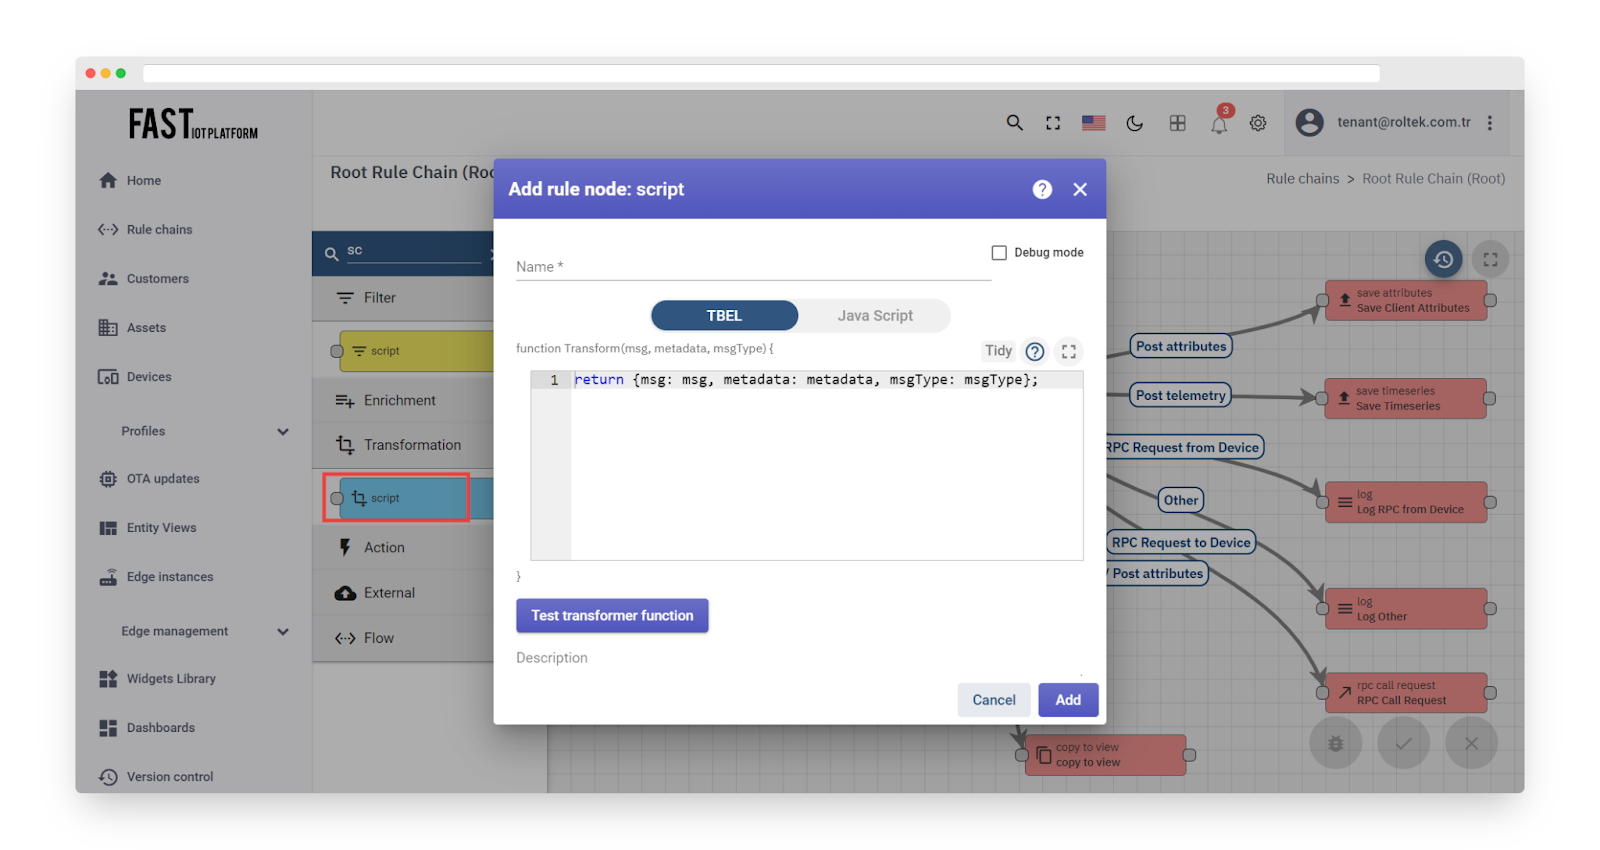
Fig. 2.2 – Add transformation script
All fields in the resulting object are optional and will be taken from the original Message if not specified.
The outbound Message from this Node will be a new Message that was constructed using the configured JavaScript function.
The JavaScript transform function can be verified using the “Test JavaScript Function” option.
Example
Node receives Message with payload:
Original Metadata:
Node receives a Message with the payload:
Original Message Type – POST_TELEMETRY_REQUEST
The following modifications should be performed:
-
Change the Message type to ‘CUSTOM_UPDATE’.
-
Add an additional attribute ‘version’ to the payload with the value ‘v1.1’.
-
Change the ‘sensorType’ attribute value in Metadata to ‘roomTemp’.
The following transform function will perform all necessary modifications:
#
To Email Node #
This Node transforms a Message into an Email Message by populating email fields using values derived from Message metadata. It sets the output Message type as ‘SEND_EMAIL’, which can be accepted later by the Send Email Node. All email fields can be configured to use values from metadata. This Node supports sending HTML pages and images.
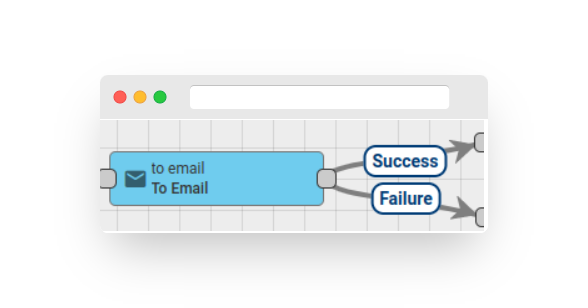
Fig. 3 – Rule node: to email
For example, if the incoming Message has a ‘deviceName’ field in the metadata, and the email body should contain its value, the value of ‘deviceName’ can be referenced as “${deviceName}” in the email template, as shown in the following example:
If you would like to send HTML or images, you can choose HTML or Dynamic as the Mail Body type. You can refer to the “Send HTML or Image Inside Email” examples for more information.
Moreover, if the incoming Message metadata contains an ‘attachments’ field with a reference to files stored in a database, this Node can prepare email attachments. Note that this feature is part of the File Storage feature supported by Fast IoT Platform.
Flow Nodes #
Flow Nodes are utilized to manage the processing flow of messages.
Acknowledge Node #
This node is designed to mark messages as successfully processed or acknowledged. For more information about message processing results, please refer to the documentation. This indicates to the rule engine that the message has been successfully processed.
This node is particularly useful when you do not want to reprocess failed messages. For example, the rule chain below will only reprocess failed messages for important messages. If an unimportant message fails, the failure will be ignored.
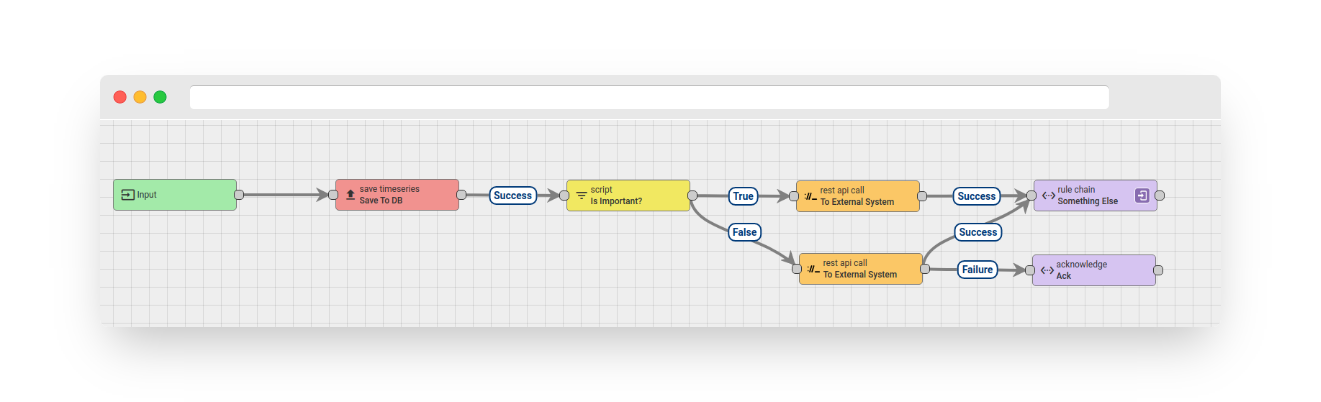
Fig. 1 – Acknowledge Node
Note that we advise the “acknowledge” rule node to be placed at the end of the message processing chain. While it’s possible to add additional rule nodes after the “acknowledge” node in theory, doing so may lead to out-of-memory (OOM) errors. For instance, if subsequent rule nodes process messages slowly, unprocessed messages will accumulate in memory and consume excessive amounts of RAM.
Checkpoint Node #
This node publishes a copy of the message to the selected rule engine queue. The original message is marked as successfully processed once the target queue acknowledges the publish of the copied message.
This is useful when you want to mark a message as high priority or process messages sequentially grouped by the originator of the message. Please refer to the default queues or define your own queue for more information.
Rule Chain Node #
This node forwards the message to the selected rule chain. The target rule chain may also output the results of processing using an output node. The output node enables the reuse of rule chains and extraction of the processing logic into modules (rule chains).
For instance, you can create a rule chain that validates incoming messages and processes valid and invalid messages separately.
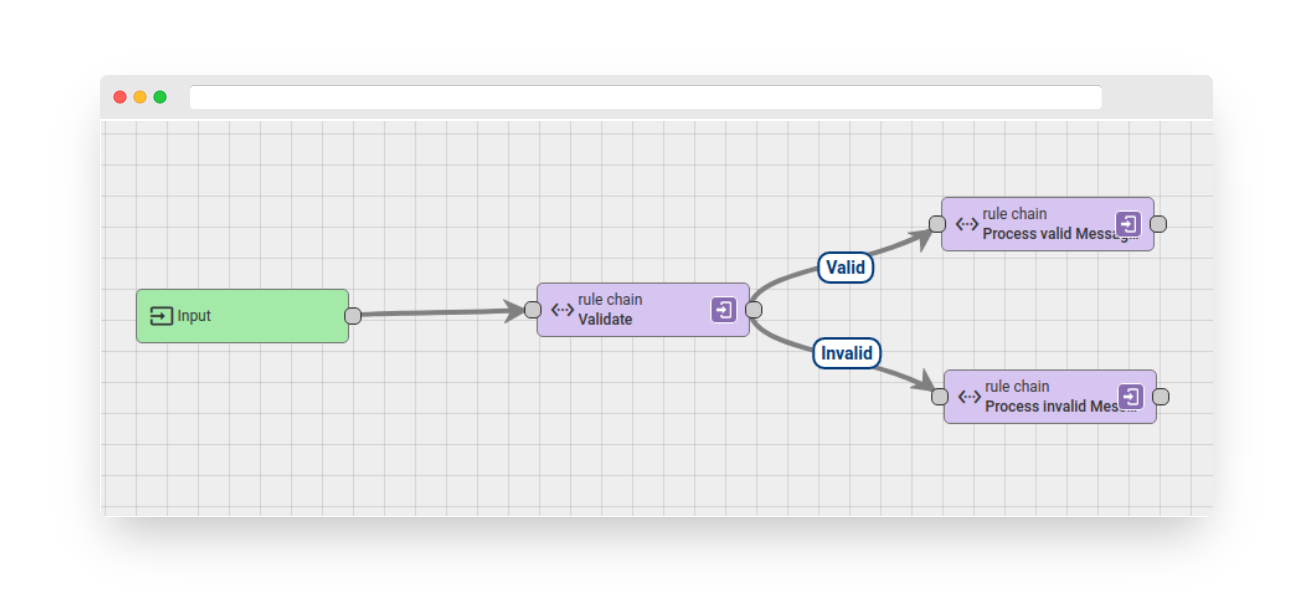
Fig. 2 – Rule chain example
The logic for validating messages can be reused in other rule chains. To achieve this, the validation logic is extracted and placed in a separate rule chain.
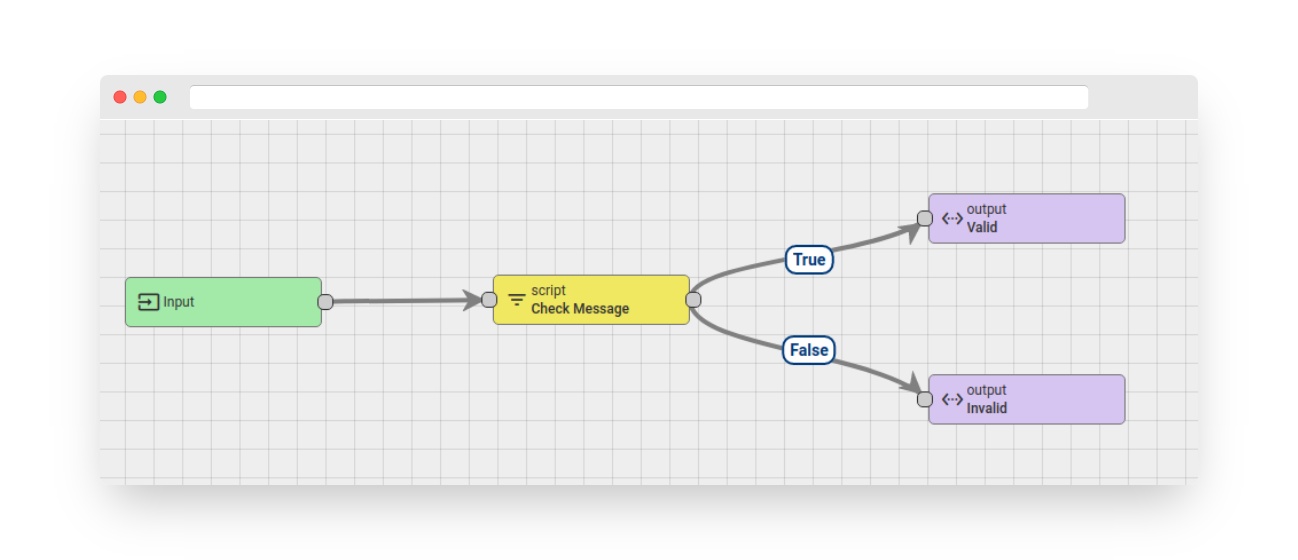
Fig. 3 – Rule chain example
Please note the usage of the “Output” nodes in the validation rule chain. The names of these output nodes should match the outgoing relations of the “rule chain node” in the main rule chain.
Output Node #
The output node is used in conjunction with the rule chain node to publish the result of message processing to the caller rule chain. The name of the output rule node corresponds to the relation type of the output message and is used to forward messages to other rule nodes in the caller rule chain. Please refer to the documentation for the rule chain node for an example.
External Nodes #
External Nodes are utilized to interact with external systems.
AWS SNS Node #
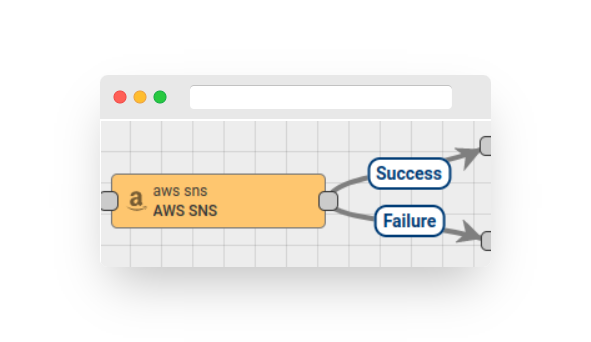
Fig. 1.1 – Rule node: AWS SNS node
This node publishes messages to AWS SNS (Amazon Simple Notification Service).
Configuration:
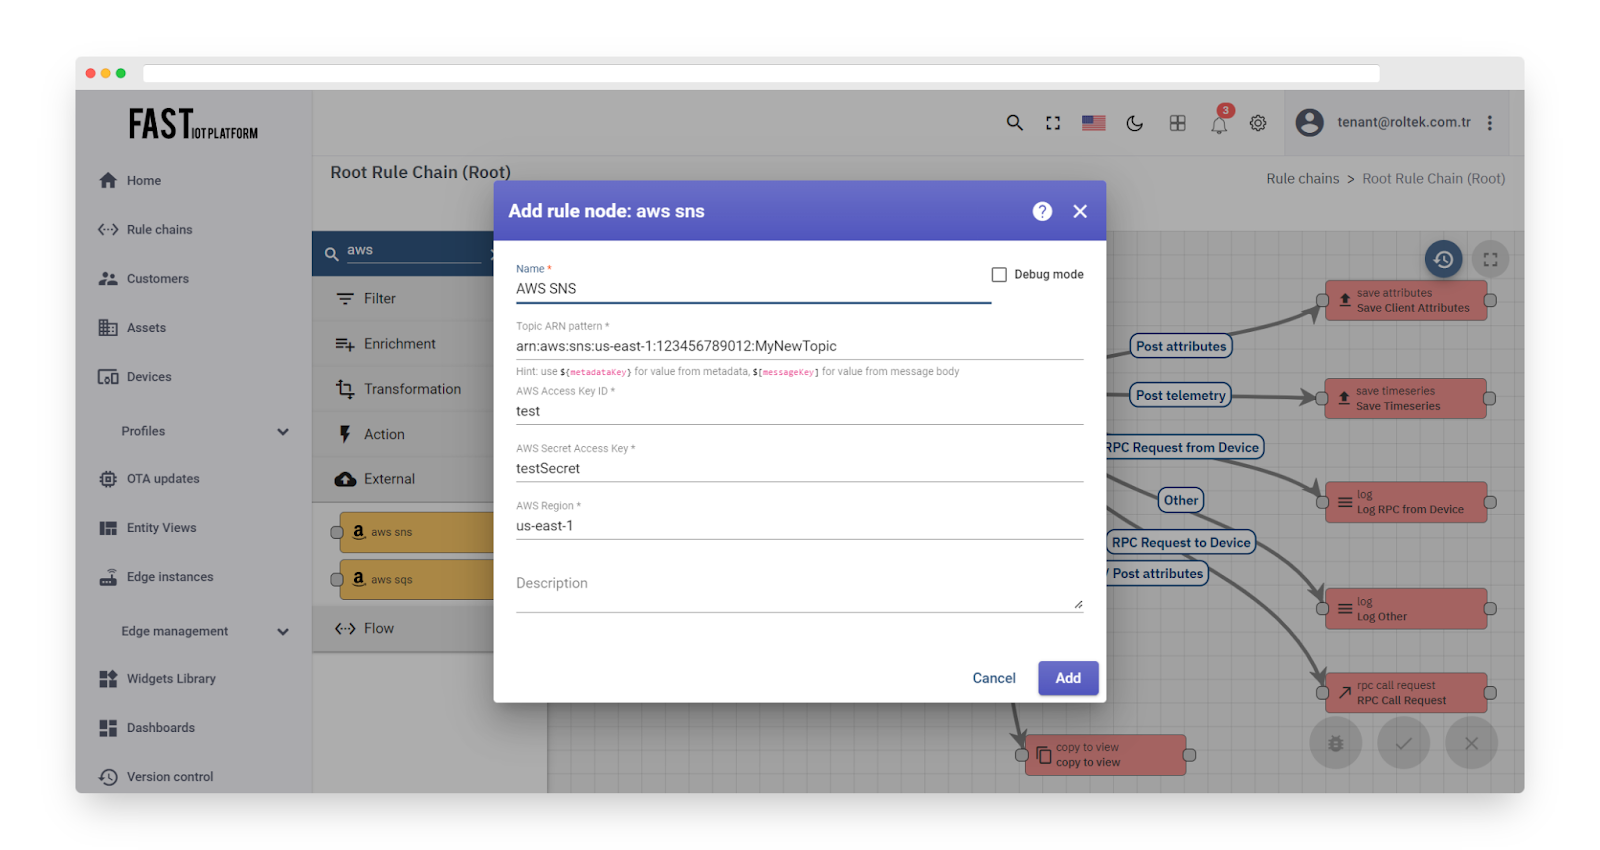
Fig. 1.2 – Add AWS SNS
-
The topic ARN pattern can be set by providing either the direct topic name for message publishing or by using a pattern that will be resolved to the actual ARN topic name using message metadata.
-
The AWS Access Key ID and AWS Secret Access Key refer to the credentials of an AWS IAM User with programmatic access. More information on AWS access keys can be found here.
-
The AWS Region must correspond to the one in which the SNS Topic(s) are created. A current list of AWS Regions can be found here.
For instance, in the following example, the topic name depends on the device type, and there is a message that contains the “deviceType” field in the metadata:
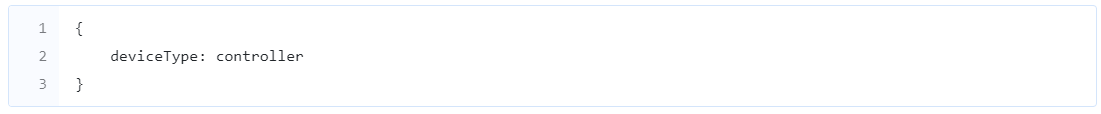
To publish a message in the controller’s topic, we need to set this pattern in the Topic ARN pattern:
During runtime, the pattern will be resolved to arn:aws:sns:us-east-1:123456789012:controller.
The node will publish the full message payload to the SNS. If necessary, the rule chain can be configured to use a chain of transformation nodes to send the correct payload to the SNS.
The outbound message from this node will contain the response messageId and requestId in the message metadata. The original message payload, type, and originator will not be modified.
AWS SQS Node #

Fig. 2.1 – Rule node: AWS SQS
Node publish messages to the AWS SQS (Amazon Simple Queue Service).
Configuration:
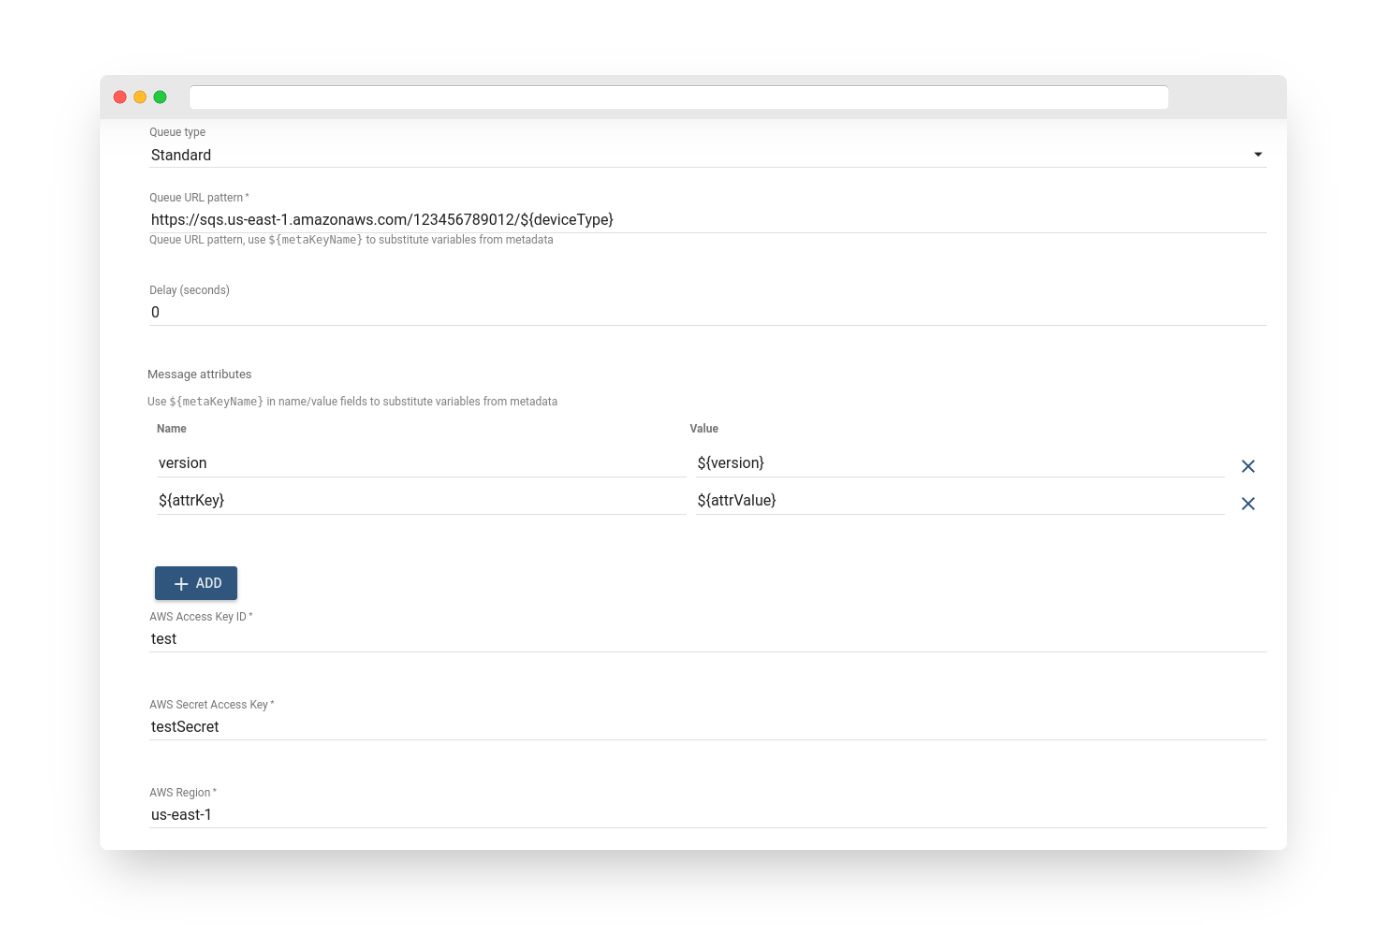
Fig. 2.2 – Add AWS SQS
-
The queue type for this node is SQS (Amazon Simple Queue Service), which can be either Standard or FIFO.
-
The queue URL pattern is used for building the queue URL and can either be a direct queue URL for message publishing or a pattern that will be resolved to the actual queue URL using message metadata.
-
The delay parameter is used to delay a specific message by a certain number of seconds.
-
The message attributes are an optional list of attributes to be published with the message.
-
The AWS Access Key ID and AWS Secret Access Key refer to the credentials of an AWS IAM User with programmatic access. More information on AWS access keys can be found here.
-
The AWS Region must correspond to the one in which the SQS Queue(s) are created. A current list of AWS Regions can be found here.
For instance, in the following example, the queue URL depends on the device type, and there is a message that contains the “deviceType” field in the metadata:

To publish a message in the controller’s queue, we need to set this pattern in the Queue URL pattern:
During runtime, the pattern will be resolved to https://sqs.us-east-1.amazonaws.com/123456789012/controller.
The node will publish the full message payload to the SQS. If necessary, the rule chain can be configured to use a chain of transformation nodes to send the correct payload to the SQS.
The optional list of attributes can be added for publishing a message in the SQS, which is a collection of pairs. Both the name and value can be static values or patterns that will be resolved using message metadata.
If a FIFO queue is selected, the message ID will be used as the deduplication ID and the message originator as the group ID.
The outbound message from this node will contain the response messageId, requestId, messageBodyMd5, messageAttributesMd5, and sequenceNumber in the message metadata. The original message payload, type, and originator will not be modified.
Kafka Node #
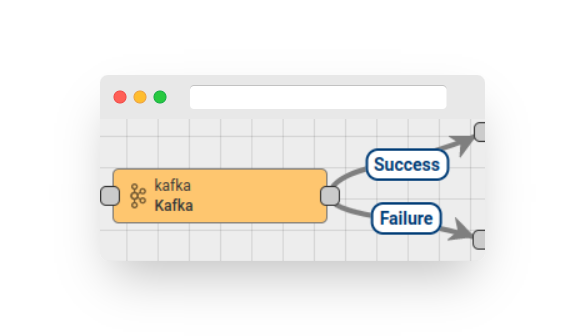
Fig. 3.1 – Rule node: Kafka
The Kafka Node is responsible for sending messages to Kafka brokers. It can handle messages of any type and sends the record via a Kafka producer to the Kafka server.
Configuration:
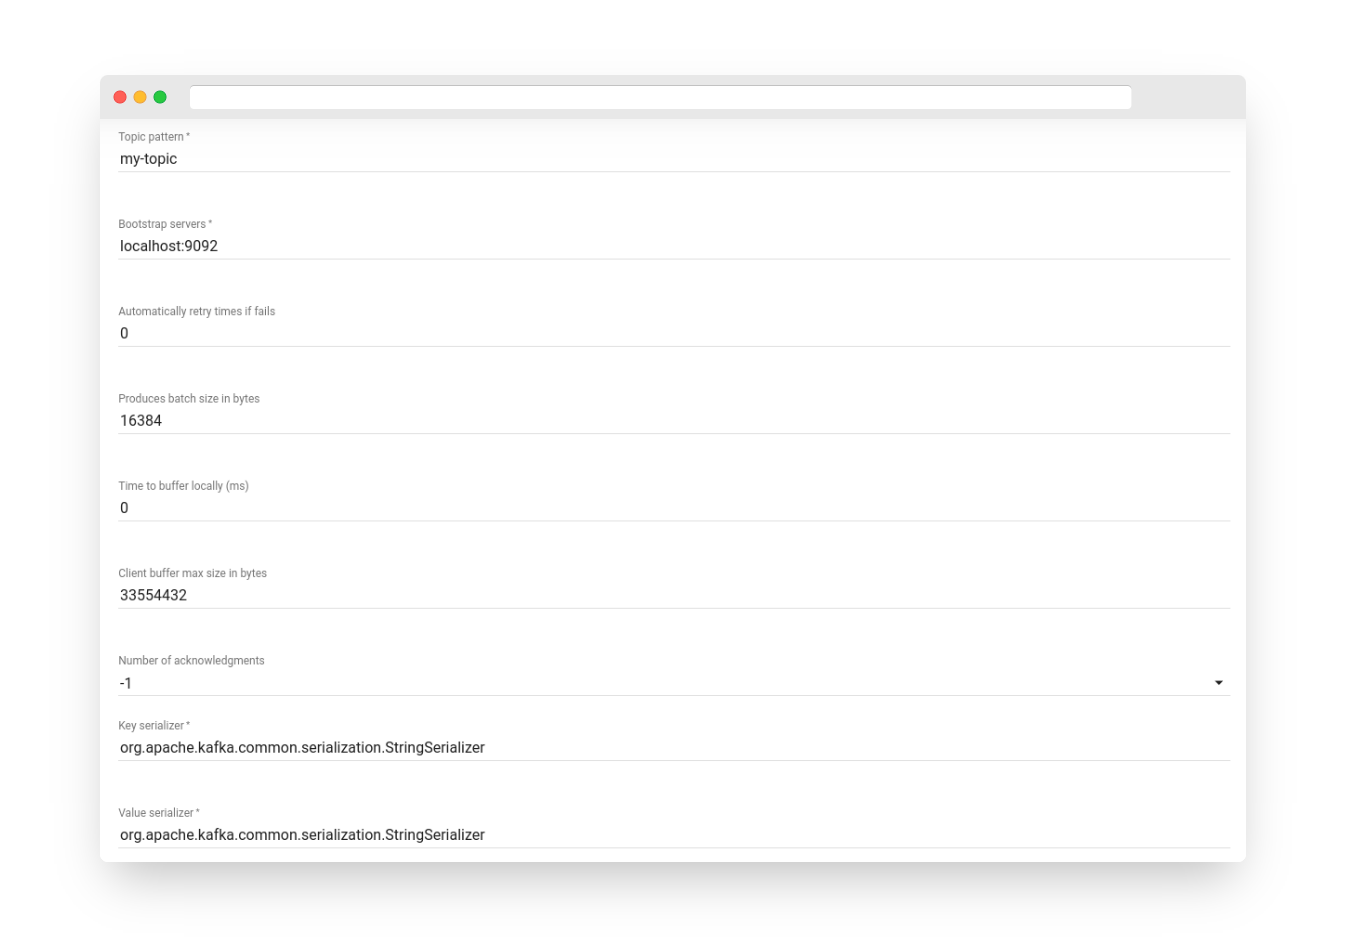
Fig. 3.2 – Add Kafka Node
-
The Kafka Node can send messages to Kafka brokers and expects messages of any type. It sends the record via a Kafka producer to the Kafka server.
-
The Topic pattern can be a static string or a pattern that is resolved using message metadata properties, such as ${deviceType}.
-
The bootstrap servers parameter specifies a list of Kafka brokers separated by a comma.
-
The automatically retry times parameter determines the number of attempts to resend a message if the connection fails.
-
The produces batch size parameter specifies the batch size in bytes for grouping messages with the same partition.
-
The time to buffer locally parameter sets the maximum local buffering window duration in milliseconds, while the client buffer max size parameter specifies the maximum buffer size in bytes for sending messages.
-
The number of acknowledgments parameter determines the number of acknowledgments the node requires to receive before considering a request complete.
-
The key serializer is, by default, org.apache.kafka.common.serialization.StringSerializer, and the value serializer is also, by default, org.apache.kafka.common.serialization.StringSerializer. Other properties can be added for the Kafka broker connection.
The node will send the full message payload to the Kafka topic. If required, the rule chain can be configured to use a chain of transformation nodes for sending the correct payload to the Kafka.
The outbound message from this node will contain the response offset, partition, and topic properties in the message metadata. The original message payload, type, and originator will not be modified.
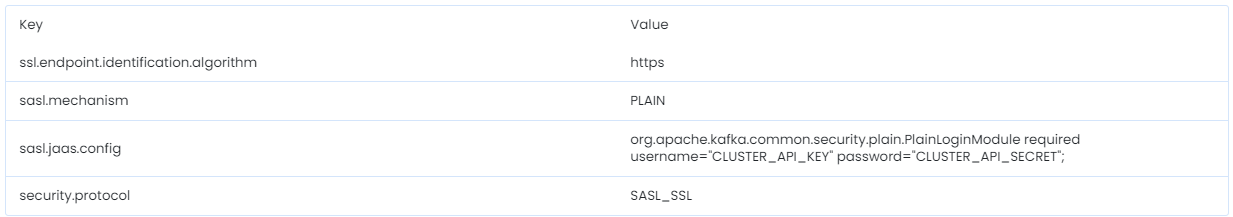
Note that if you want to use Confluent Cloud as a Kafka broker, you should add the following properties:
-
CLUSTER_API_KEY – your access key from Cluster settings.
-
CLUSTER_API_SECRET – your access secret from Cluster settings.
MQTT Node #
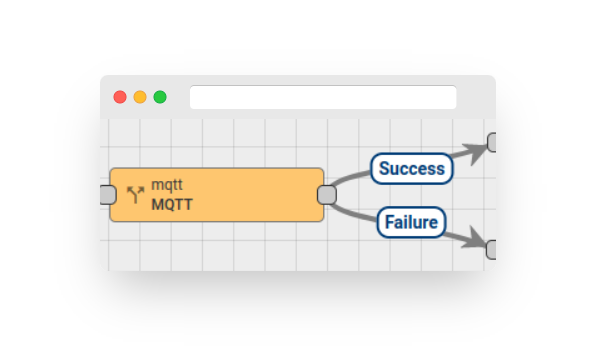
Fig. 4.1 – Rule node: MQTT node
Publish the incoming message payload to the topic of the configured MQTT broker with at least once Quality of Service (QoS).
Configuration:
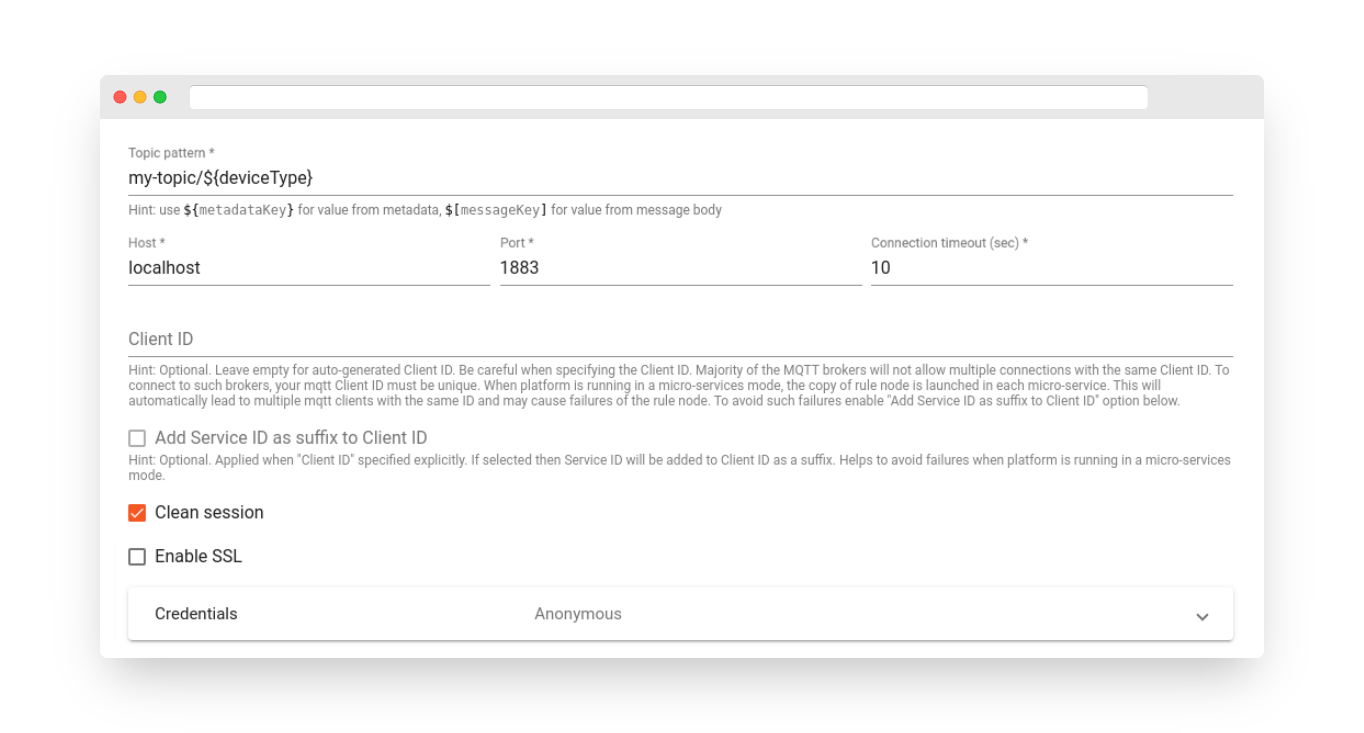
Fig. 4.2 – Add MQTT Node
-
Topic Pattern – It can be a static string or a pattern that can be resolved using Message Metadata properties, for example, ${deviceType}.
-
Host – The MQTT broker host.
-
Port – The MQTT broker port.
-
Connection Timeout – The timeout in seconds for connecting to the MQTT broker.
-
Client ID – An optional client identifier used for connecting to the MQTT broker. If not specified, the default generated clientId will be used.
-
Add Service ID as Suffix to Client ID – An optional flag. When enabled, the server ID will be added as a suffix to the client ID. It is useful when running in microservices mode to allow rule nodes on each node to connect to the broker without errors.
-
Clean Session – Establishes a non-persistent connection with the broker when enabled.
-
SSL Enable/Disable – Enables/disables secure communication.
-
Credentials – MQTT connection credentials. It can be Anonymous, Basic, or PEM.
Different authentication credentials are supported for an external MQTT broker:
-
Anonymous – No authentication
-
Basic – Username/password pair is used for authentication
-
PEM – PEM certificates are used for authentication
If the PEM credentials type is selected, the following configuration should be provided:
-
CA certificate file
-
Certificate file
-
Private key file
-
Private key password
Published Body – The node will send the full Message payload to the MQTT topic. If required, the rule chain can be configured to use a chain of Transformation Nodes for sending the correct Payload to the MQTT broker.
In case of a successful message publishing, the original Message will be passed to the next nodes via the Success chain. Otherwise, the Failure chain is used.
Azure IoT Hub Node #
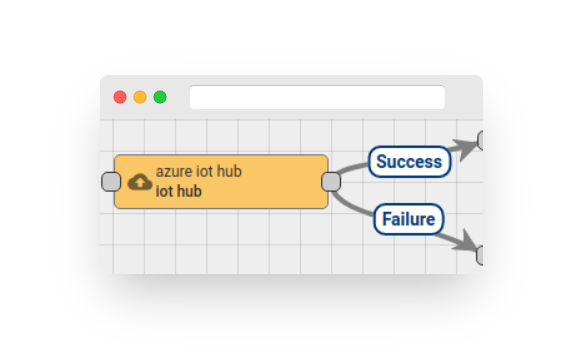
Fig. 5.1 – Rule node: Azure IoT Hub Node
Configuration:
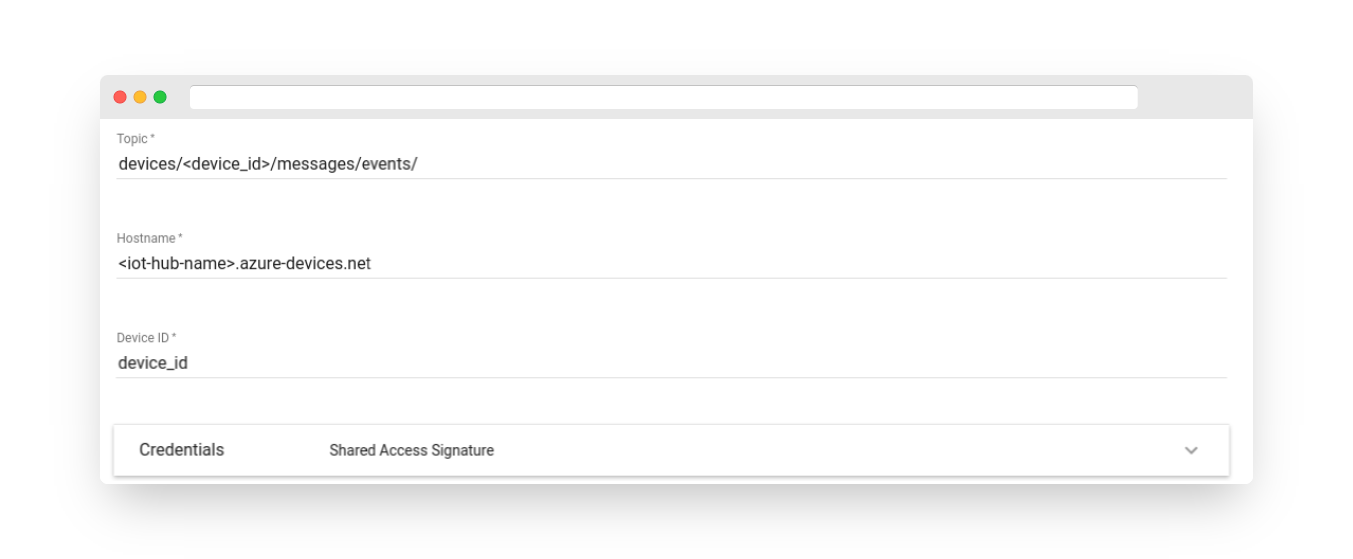
Fig. 5.2 – Add Azure IoT Hub Node
-
Topic – For more information about IoT Hub topics, use the following link.
-
Hostname – The Azure IoT Hub hostname.
-
Device ID – Your device ID from Azure IoT Hub.
-
Credentials – Azure IoT Hub connection credentials. It can be either Shared Access Signature or PEM.
Different authentication credentials are supported for Azure IoT Hub:
-
Shared Access Signature – SAS key is used for authentication.
-
PEM – PEM certificates are used for authentication.
If Shared Access Signature credentials type is selected, the following configuration should be provided:
-
SAS Key – It is the key from your device in Azure IoT Hub.
-
CA certificate file, by default Baltimore certificate is used. More about certificates can be found here.
If PEM credentials type is selected, the following configuration should be provided:
-
CA certificate file, by default Baltimore certificate is used. More about certificates can be found here.
-
Certificate file
-
Private key file
-
Private key password.
Published body – The node will send the full Message payload to the Azure IoT Hub device. If required, the rule chain can be configured to use a chain of Transformation Nodes for sending the correct Payload to the Azure IoT Hub.
In case of a successful message publishing, the original Message will be passed to the next nodes via the Success chain. Otherwise, the Failure chain is used.
RabbitMQ Node #
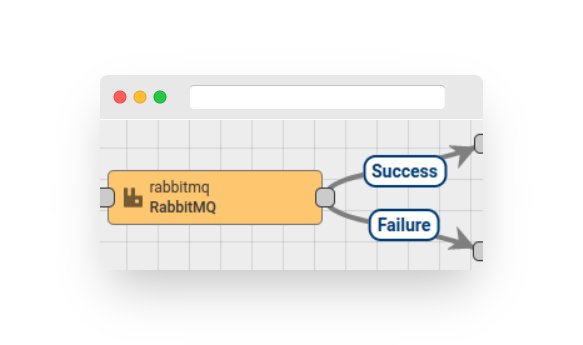
Fig. 6.1 – Rule node: RabbitMQ
Publish the incoming message payload to RabbitMQ.
Configuration:
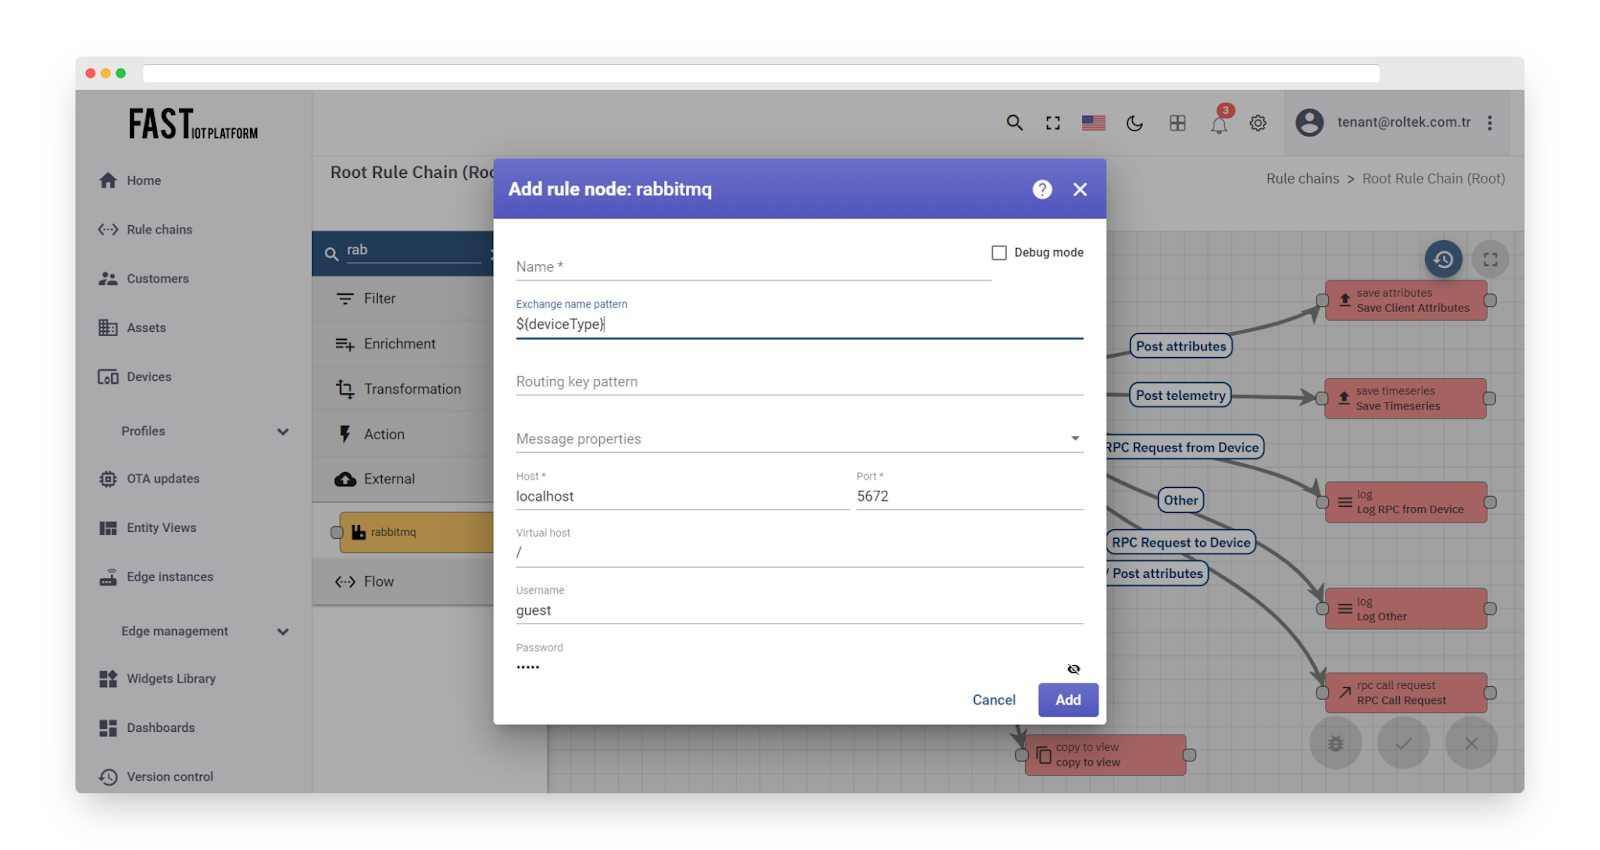
Fig. 6.2 – Add rabbitmq
-
Exchange name pattern – the exchange to which the message will be published. It can be a static string or a pattern that is resolved using Message Metadata properties. For example, ${deviceType}.
-
Routing key pattern – the routing key. It can be a static string or a pattern that is resolved using Message Metadata properties. For example, ${deviceType}.
-
Message properties – optional routing headers. Supported headers include BASIC, TEXT_PLAIN, MINIMAL_BASIC, MINIMAL_PERSISTENT_BASIC, PERSISTENT_BASIC, and PERSISTENT_TEXT_PLAIN.
-
Host – the default host to use for connections.
-
Port – the default port to use for connections.
-
Virtual host – the virtual host to use when connecting to the broker.
-
Username – the AMQP username to use when connecting to the broker.
-
Password – the AMQP password to use when connecting to the broker.
-
Automatic recovery – enables or disables automatic connection recovery.
-
Connection timeout – the TCP establishment timeout in milliseconds; zero for infinite.
-
Handshake timeout – the AMQP 0-9-1 protocol handshake timeout, in milliseconds.
-
Client properties – additional properties that are sent to the server during connection startup.
Published body – the node will send the full message payload to RabbitMQ. If required, the rule chain can be configured to use a chain of Transformation Nodes for sending the correct payload.
In case of successful message publishing, the original message will be passed to the next nodes via the Success chain. Otherwise, the Failure chain is used.
REST API Call Node #
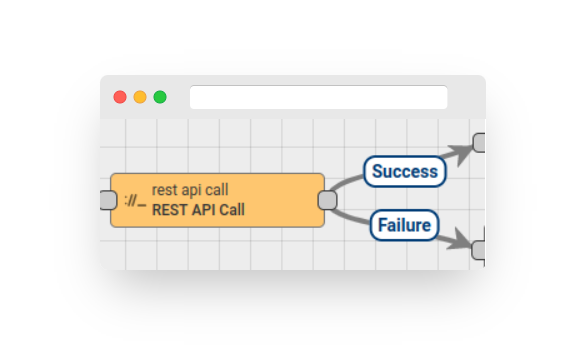
Fig. 7.1 – Rule node: REST API Call Node
Make REST API calls to an external REST server.
Configuration:
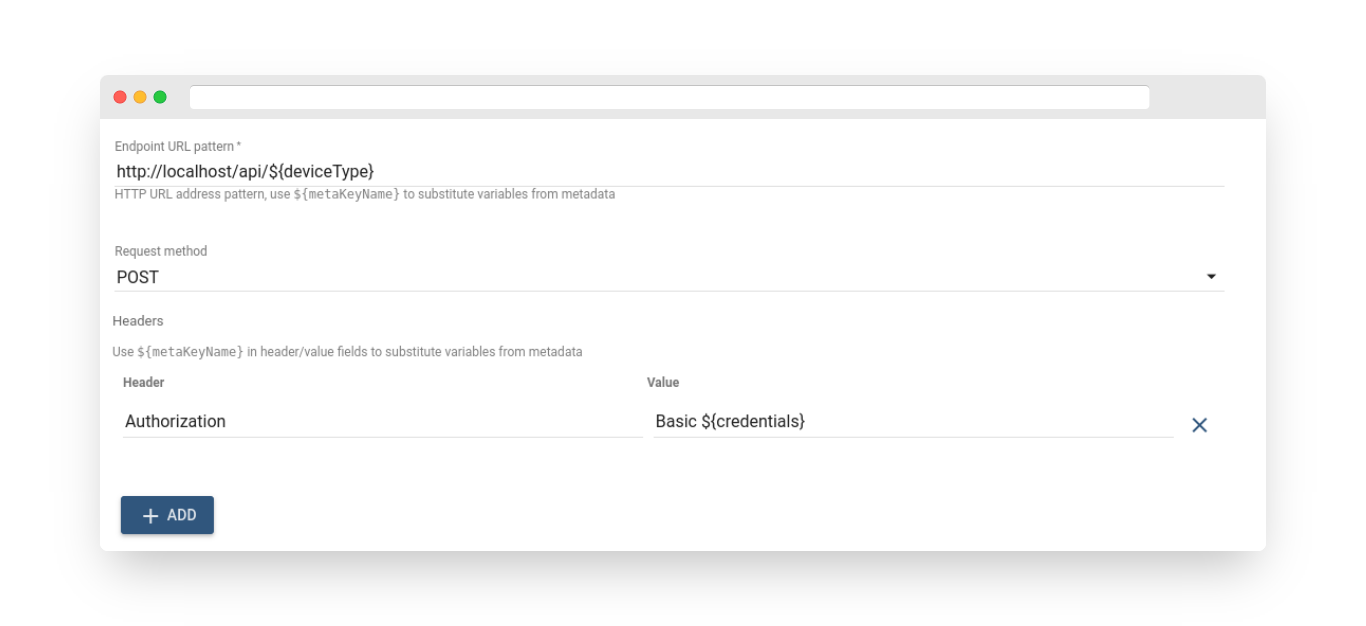
Fig. 7.2 – Add Rest Api Call Node
-
Endpoint URL pattern – It can be a static string or a pattern that is resolved using Message Metadata properties. For example, ${deviceType}.
-
Request method – GET, POST, PUT, DELETE.
-
Headers – Request headers where the header or value can be a static string or a pattern that is resolved using Message Metadata properties.
Endpoint URL
The URL can be a static string or a pattern that uses only the message metadata for resolving patterns. Therefore, property names used in the patterns must exist in the message metadata. Otherwise, the raw pattern will be added to the URL.
For instance, if the message payload contains a property called deviceType with a value of container, the following pattern:
http://localhost/api/${deviceType}/update
will be resolved to:
http://localhost/api/container/update
Headers
A collection of header names and values can be configured, which will be added to the REST request. Patterns can be used to configure both the header name and value, for example, ${deviceType}. Only the message metadata is used for resolving patterns. Therefore, property names used in the pattern must exist in the message metadata. Otherwise, the raw pattern will be added to the header.
The node will send the full message payload to the configured REST endpoint as the request body. If required, the rule chain can be configured to use a chain of Transformation Nodes to send the correct payload.
The outbound message from this node will contain the response status, statusCode, statusReason, and response headers in the message metadata. The outbound message payload will be the same as the response body. The original message type and originator will not be changed.
To send a single file as the request body, add a field called “attachments” to the message metadata with the file UUID stored in the database. In that case, any message data will be ignored, and only the file content will be sent. To define the request content type, use the header setting, such as:
Content-Type: application/json; charset=UTF-8
Here is an example of message metadata to send a single file:
Note: This feature is part of the File Storage feature supported by Fast IoT Platform Professional Edition.
In the case of a successful request, the outbound message will be passed to the next nodes via the Success chain. Otherwise, the Failure chain will be used.
Send Email Node #
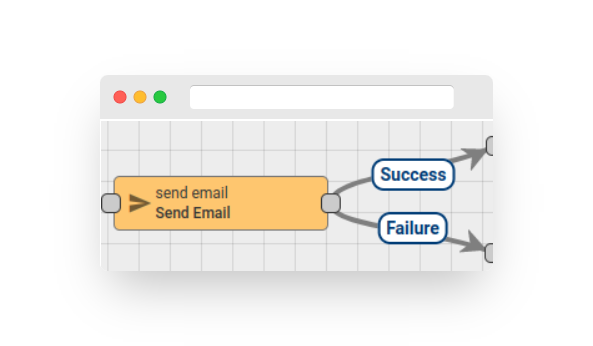
Fig. 8.1 – Rule node: Send Email
The node sends an incoming message using the configured mail server. This node only works with messages that were created using the To Email transformation node. Please connect this node with the To Email node using the Success chain.
Configuration:
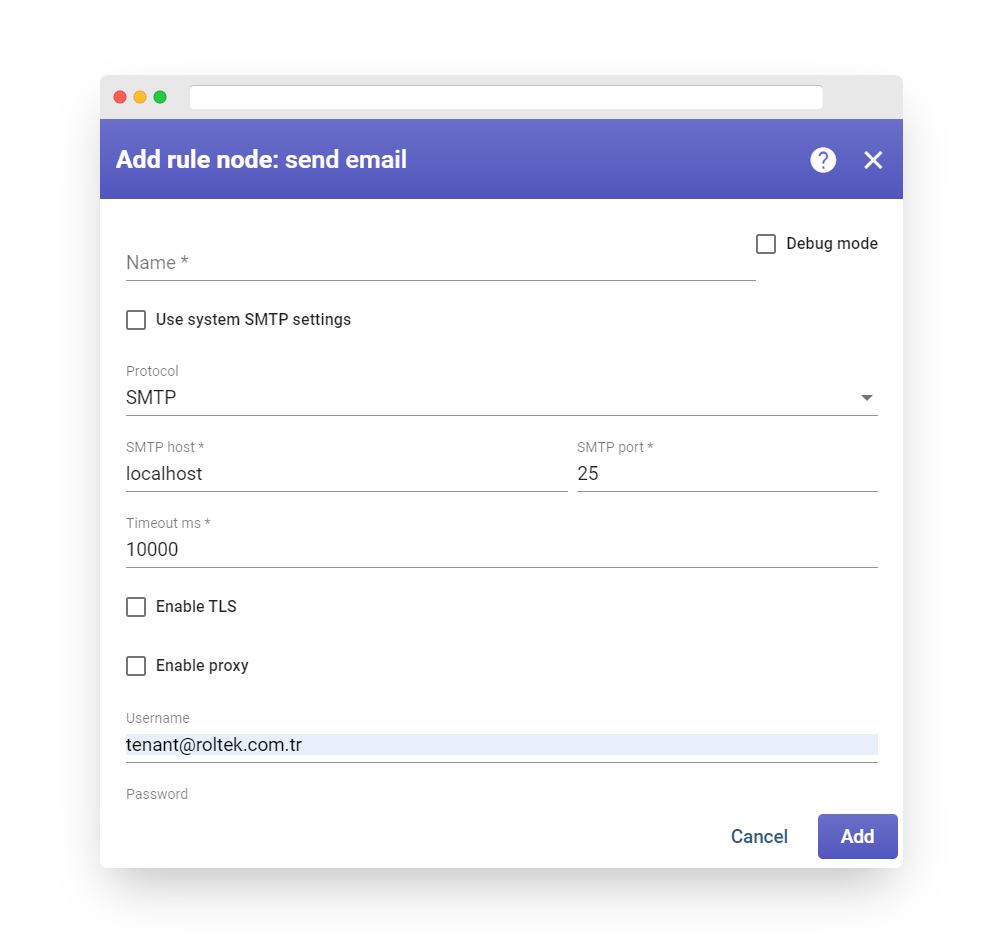
Fig. 8.2 – Add send email
The node sends an incoming message using the configured mail server. If enabled, the default mail server configured at the system level will be used. The SMTP protocol and server host and port can be specified, along with the read timeout in milliseconds. If supported by the server, enabling TLS will use the STARTTLS command. If a username and password are required for the mail host, they can be specified as well.
This node can work with the default mail server configured at the system level. Please refer to the documentation for more details on how to configure the default system SMTP settings. If a specific mail server is required for this node, disable the ‘Use system SMTP settings’ checkbox and configure the mail server manually.
Additionally, this node can create email attachments if the incoming message has a ‘prepared attachments’ metadata field with references to files stored in the database. Multiple attachments are supported, and comma-separated UUIDs can be used to send multiple files. Here is an example of message metadata:
In the case of successful mail sending, the original message will be passed to the next nodes via the Success chain. Otherwise, the Failure chain will be used.
You can see a real-life example of this node in the following tutorial:
Send SMS Node #
The node can construct an SMS message based on the metadata fields from the incoming message and send it using AWS SNS or Twilio SMS providers. We recommend enabling debug mode for this rule node.
Configuration:
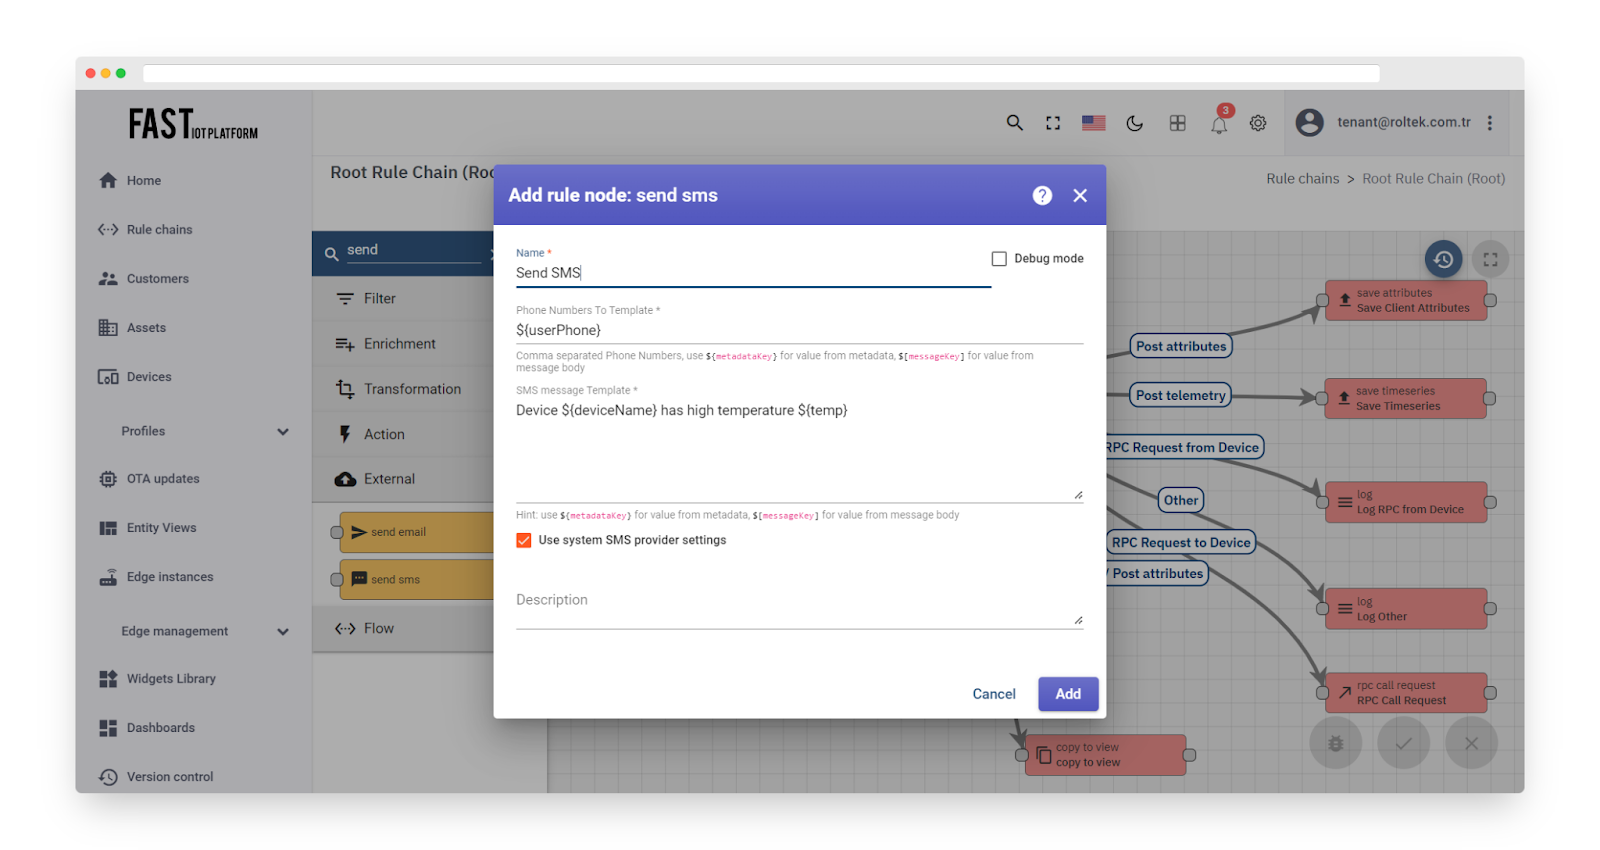
Fig. 9 – Add send sms
If enabled, the node will use the default SMS provider server configured at the system level. Please refer to the SMS provider settings for more details. The ‘Phone Numbers To’ field allows multiple phone numbers to be specified, and the SMS message template can be configured as well. Message metadata fields can also be referenced in both of these fields.
This node can work with the default SMS provider configured at the system level. If the SMS message is successfully sent to all recipients, the original message will be passed to the next nodes via the Success chain. Otherwise, the Failure chain will be used.
Action Nodes #
The Action Nodes execute different actions based on the incoming message.
Math Function Node #
The rule node applies mathematical functions and saves the result in the message and/or database.
This rule node supports five types of arguments:
-
Constant
-
Value from the message body
-
Value from the message metadata
-
Value of the attribute belonging to the message originator (device, asset, etc.) that should be of numeric type or a string convertible to a float
-
Value of the latest time-series belonging to the message originator (device, asset, etc.) that should be of numeric type or a string convertible to a float.
The primary use case for this rule node is to modify one or more values from the database based on data from the incoming message. For instance, you can increase the totalwaterconsumption based on the deltawaterconsumption reported by the device.
An alternative use case is to replace simple JS script nodes with a more lightweight and performant implementation. For example, you can use the CUSTOM operation to transform Fahrenheit to Celsius (C = (F – 32) / 1.8) using the expression: (x – 32) / 1.8).
The execution is synchronized within the scope of the message originator (e.g., device) and server node. If you have rule nodes in different rule chains, they will process messages from the same originator synchronously within the scope of the server node.
The result of the function can be added to the message body or metadata. You can also save the result as an attribute or time-series in the database.
Create Alarm Node #
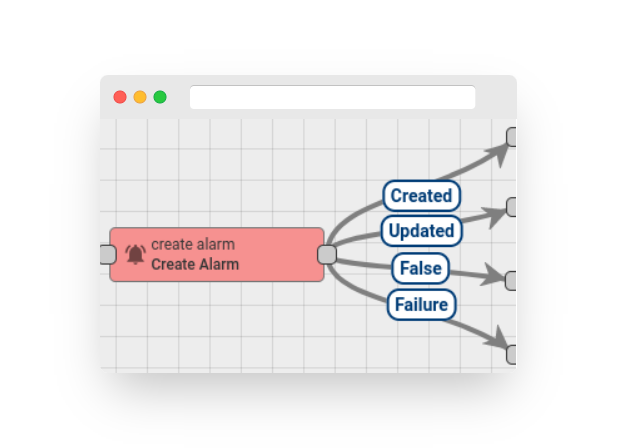
Fig. 1.1 – Rule node: Create Alarm
This node attempts to load the latest alarm with the configured alarm type for the message originator. If an uncleared alarm exists, it will be updated; otherwise, a new alarm will be created.
Node Configuration:
-
Alarm Details Builder script
-
Alarm Type – any string that represents the alarm type
-
Alarm Severity – {CRITICAL | MAJOR | MINOR | WARNING | INDETERMINATE}
-
Is Propagate – whether the alarm should be propagated to all parent related entities.
Note: The rule node has the ability to:
-
Read alarm config from message
-
Get the alarm type using a pattern with fields from the message metadata.
Filter the propagation of alarms to parent entities based on their relation types:
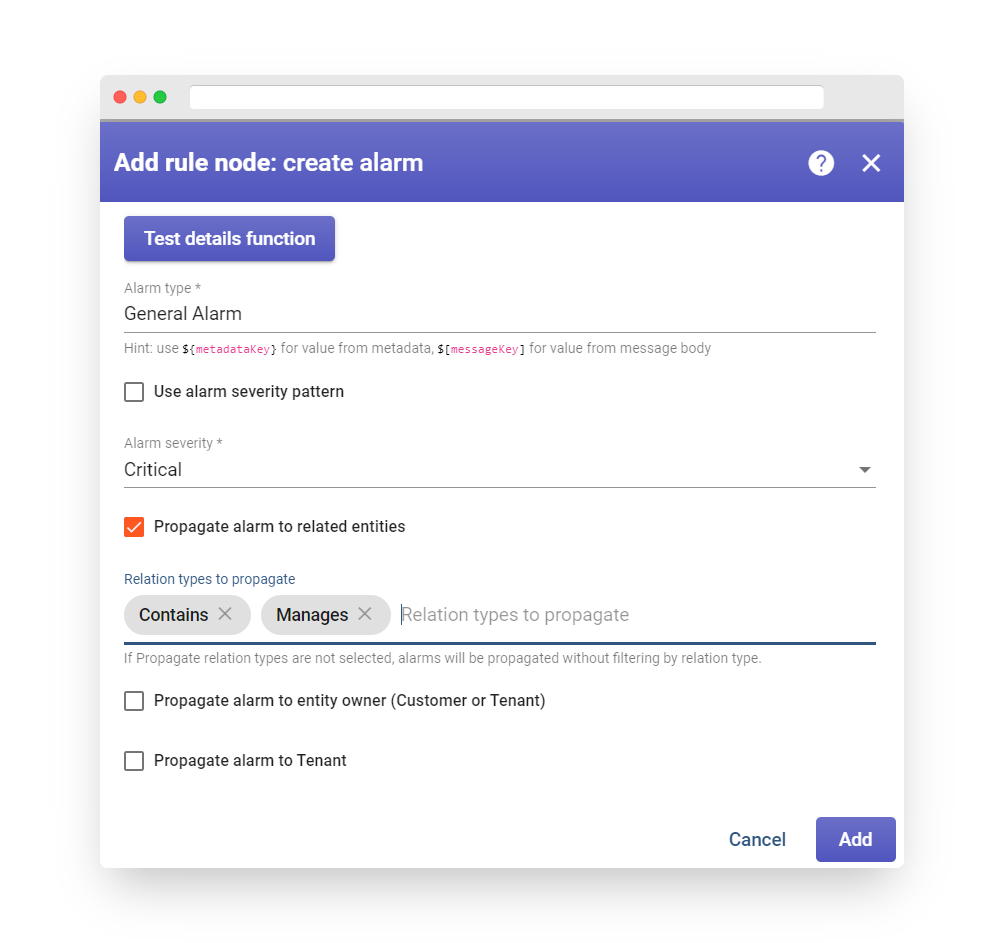
Fig. 1.2 – Add create alarm
The Alarm Details Builder script is used to generate a JsonNode containing the alarm details. It is useful for storing additional parameters within the alarm. For example, you can save attribute name/value pairs from the original message payload or metadata.
The Alarm Details Builder script should return the details object.
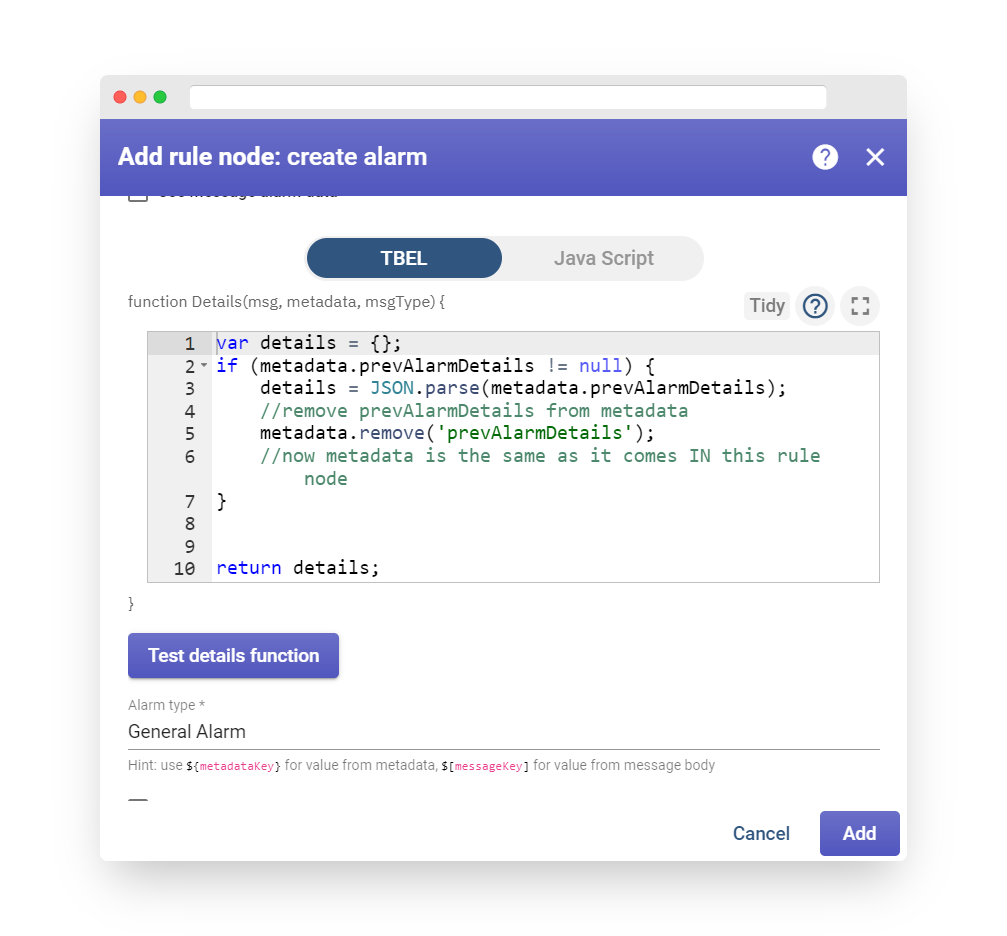
Fig. 1.3 – Alarm Details Builder
-
The message payload can be accessed using the msg property, for example msg.temperature.
-
The message metadata can be accessed using the metadata property, for example metadata.customerName.
-
The message type can be accessed using the msgType property, for example msgType.
Optionally, previous Alarm Details can be accessed using the metadata.prevAlarmDetails property. If the previous alarm does not exist, this field will not be present in the metadata. Note that metadata.prevAlarmDetails is a raw string field and it needs to be converted into an object using the following construction:

The Alarm Details Builder script function can be verified using the Test JavaScript function.
Example of Details Builder Function:
This function takes the count property from the previous alarm and increments it. It also puts the temperature attribute from the inbound message payload into the alarm details.
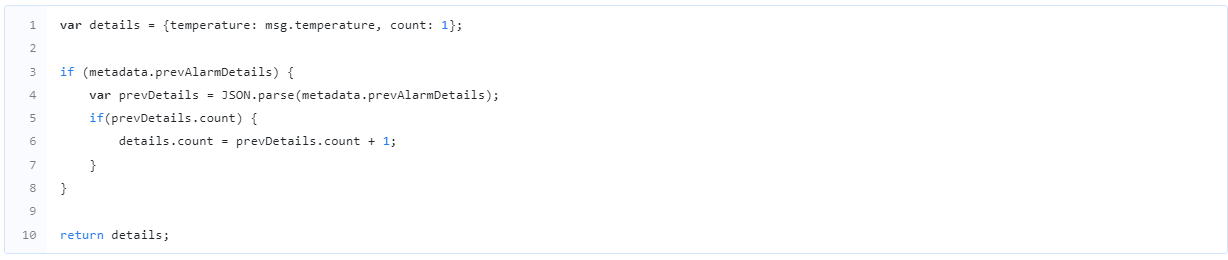
The alarm will be created or updated with the following properties:
-
Alarm details: an object returned from the Alarm Details Builder script.
-
Alarm status: if a new alarm is created, the status will be ACTIVE_UNACK. If an existing alarm is updated, the status will not change.
-
Severity: a value from the Node Configuration.
-
Propagation: a value from the Node Configuration.
-
Alarm type: a value from the Node Configuration.
-
Alarm start time: if a new alarm is created, the start time will be the current system time. If an existing alarm is updated, the start time will not change.
-
Alarm end time: the current system time.
The outbound message will have the following structure:
-
Message Type: ALARM
-
Originator: the same originator as the inbound message
-
Payload: a JSON representation of the new or updated alarm
-
Metadata: all fields from the original message metadata
After a new alarm is created, the outbound message will contain an additional property inside the metadata called isNewAlarm, with a value of true. The message will be passed via the Created chain.
After an existing alarm is updated, the outbound message will contain an additional property inside the metadata called isExistingAlarm, with a value of true. The message will be passed via the Updated chain.
Here is an example of an outbound message payload:
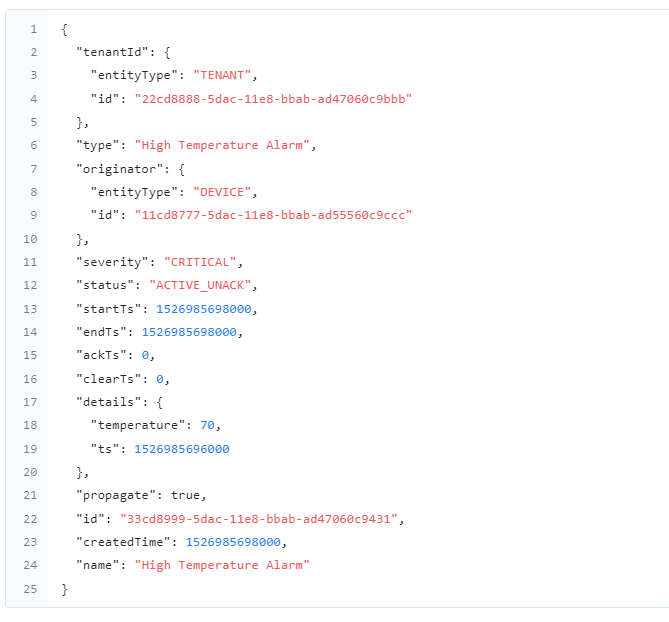
You can see a real-life example of this node being used in the following tutorial:
#
#
#
Clear Alarm Node #
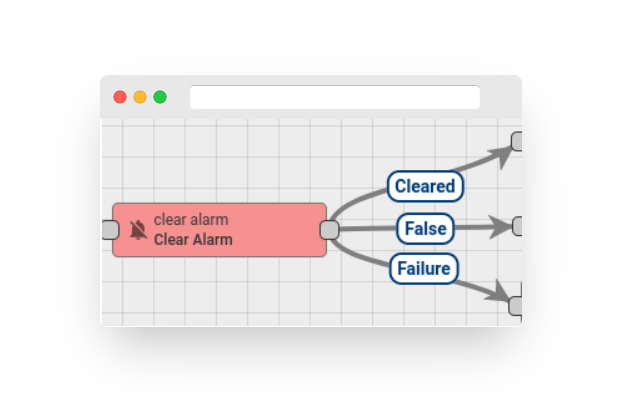
Fig. 2.1 – Rule node: clear alarm
This node loads the latest alarm with the configured Alarm Type for the message originator and clears the alarm if it exists.
Node configuration:
-
Alarm Details Builder script
-
Alarm Type: any string that represents the Alarm Type.
Note: The rule node has the ability to retrieve the alarm type using a pattern with fields from the message metadata.
The Alarm Details Builder script is used to update the Alarm Details JsonNode, which is useful for storing additional parameters inside the alarm. For example, you can save attribute name/value pairs from the original message payload or metadata.
The Alarm Details Builder script should return a details object.
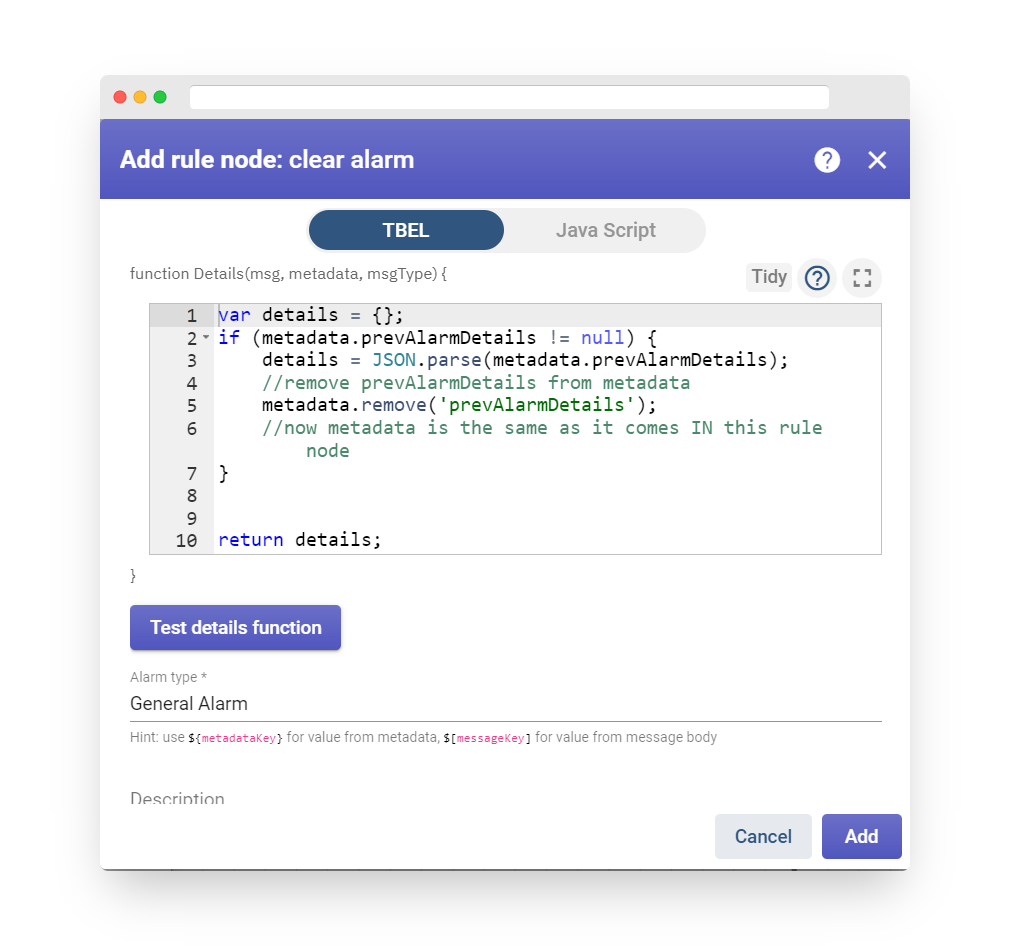
Fig. 2.2 – Add clear alarm
-
The message payload can be accessed via the msg property, for example, msg.temperature.
-
Message metadata can be accessed via the metadata property, for example, metadata.customerName.
-
Message type can be accessed via the msgType property, for example, msgType.
-
Current Alarm Details can be accessed via metadata.prevAlarmDetails.
Note that metadata.prevAlarmDetails is a raw string field, and it needs to be converted into an object using the following construction:
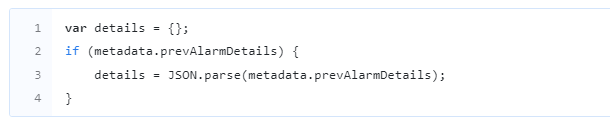
The Alarm Details Builder script function can be verified using the Test JavaScript function.
Here is an example of a Details Builder function:
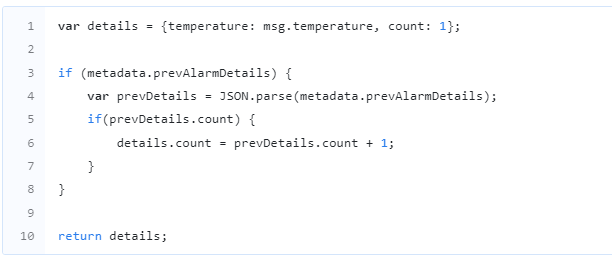
This function retrieves the previous alarm details, increments the count by 1, and adds the temperature attribute from the inbound message payload to the alarm details.
This node updates the current alarm in the following way:
-
Changes the alarm status to CLEARED_ACK if it was already acknowledged, otherwise to CLEARED_UNACK.
-
Sets the clear time to the current system time.
-
Updates the alarm details with the new object returned from the Alarm Details Builder script.
In case the alarm does not exist or it is already cleared, the original message will be passed to the next nodes via the False chain. Otherwise, a new message will be passed via the Cleared chain.
The outbound message will have the following structure:
-
Message Type: ALARM
-
Originator: the same originator from the inbound message
-
Payload: JSON representation of the cleared alarm
-
Metadata: all fields from the original message metadata. Additionally, an additional property inside Metadata will be added -> isClearedAlarm with a true value.
Here is an example of an outbound message payload:
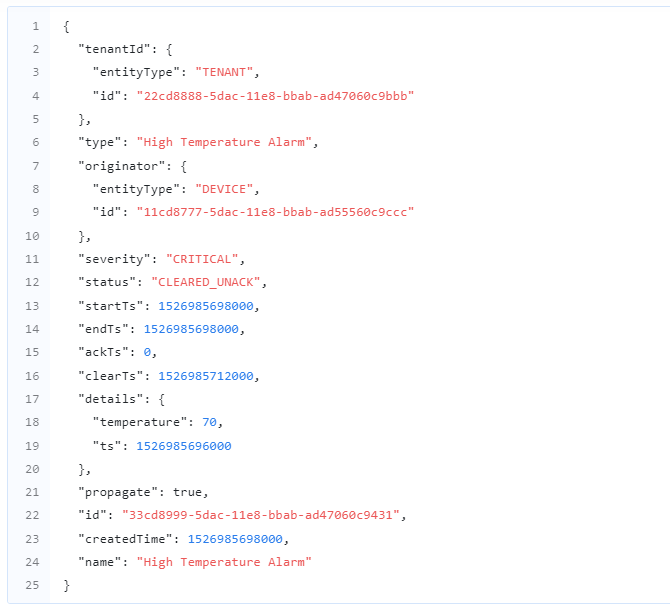
You can see a real-life example of this node being used in the following tutorial:
Delay Node #
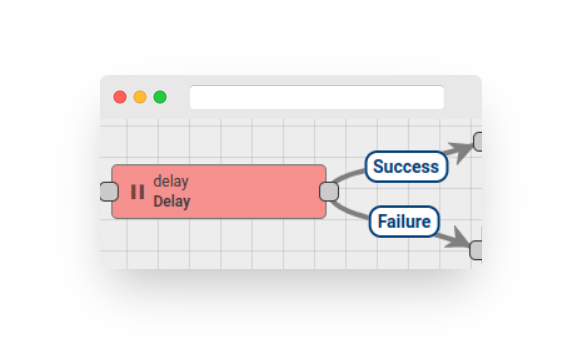
Fig. 3.1 – Rule node: delay
This node delays incoming messages for a configurable period.
Configuration:
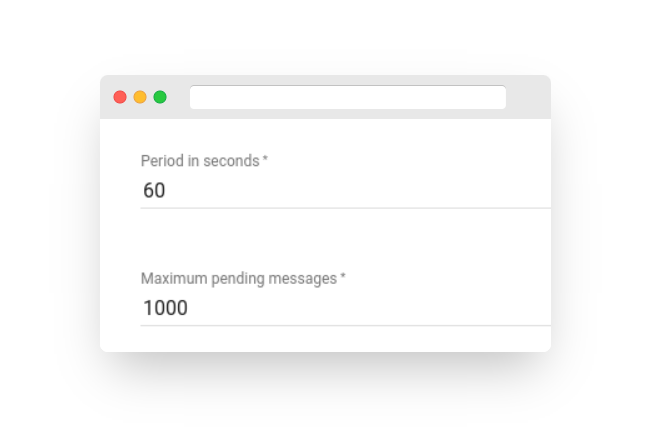
Fig. 3.2 – Delay node configuration
This refers to a system where incoming messages can be suspended for a specific period, and there is a limit to the number of messages that can be queued at once. Once the delay period for a suspended message is over, it will be routed to the next nodes via the Success chain. However, if the maximum limit for pending messages is reached, the next message will be routed via the Failure chain.
Generator Node #
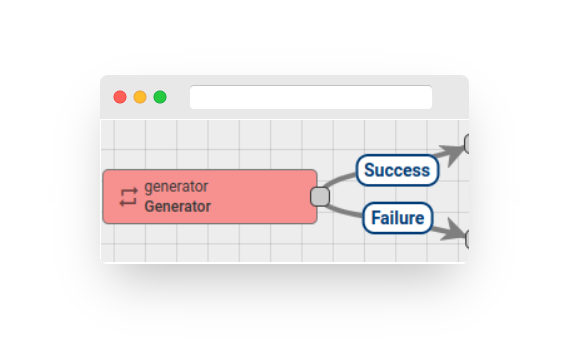
Fig. 4.1 – Rule node: Generator
This is referring to a system that generates messages with a configurable period using a JavaScript function for message generation. The node configuration includes the message generation frequency in seconds, the message originator, and the JavaScript function that will generate the actual message.
The JavaScript function receives three input parameters:
-
prevMsg, which is the payload of the previously generated message,
-
prevMetadata, which is the metadata of the previously generated message,
-
prevMsgType, which is the type of the previously generated message.
The script should return the following structure:
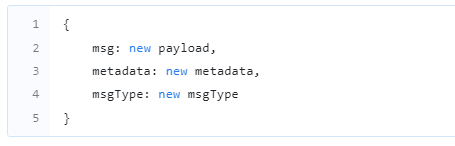
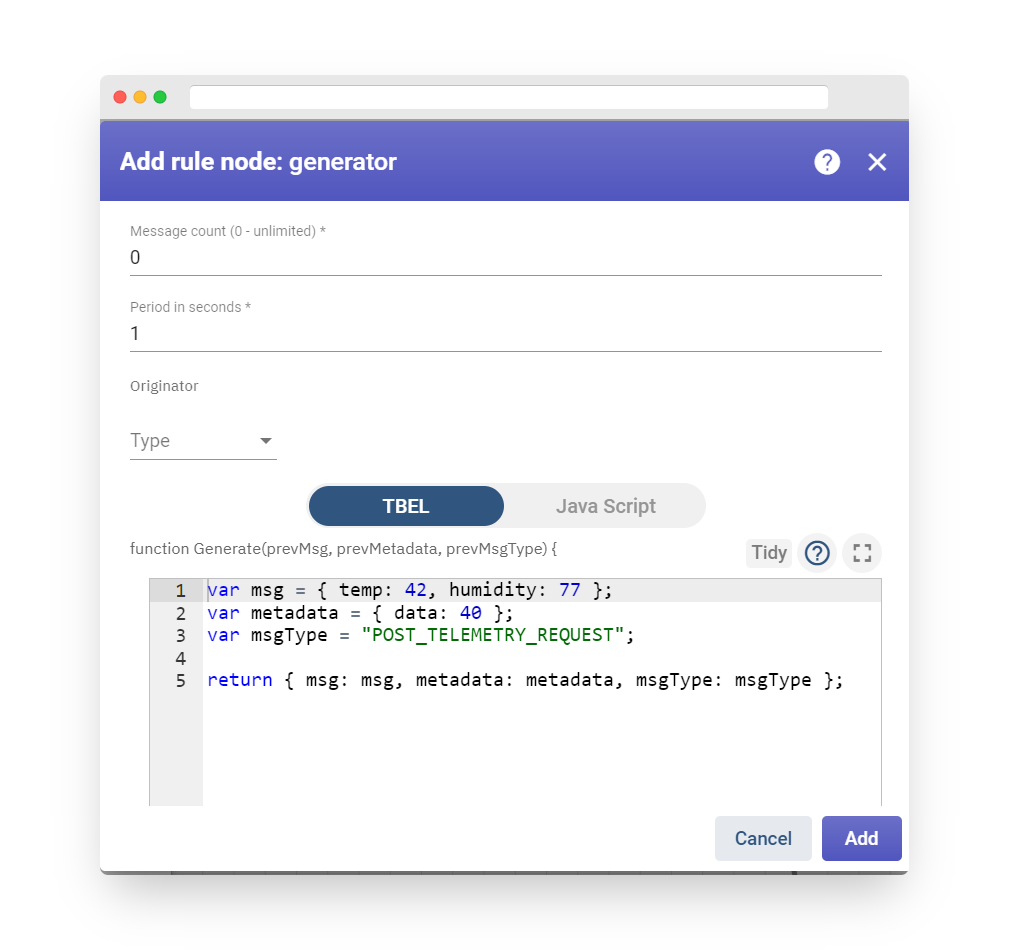
Fig. 4.2 – Add generator
All fields in the resulting object are optional and will be populated with values from the previously generated message if not explicitly specified.
The outbound message from this node will be a new message constructed using the configured JavaScript function.
The JavaScript generator function can be tested using the Test JavaScript function.
This node can be used for debugging purposes in a rule chain.
Log Node #
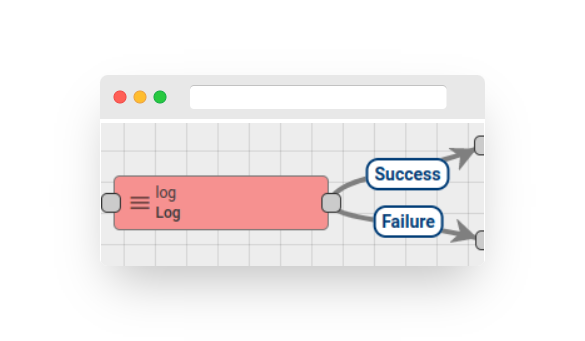
Fig. 5.1 – Rule node: log
This node transforms incoming messages using a configured JavaScript function to a string and logs the final value in the Fast IoT Platform log file.
The logging is done at the INFO log level.
The JavaScript function receives three input parameters: metadata, which is the message metadata, msg, which is the message payload, and msgType, which is the message type.
The script should return a string value.
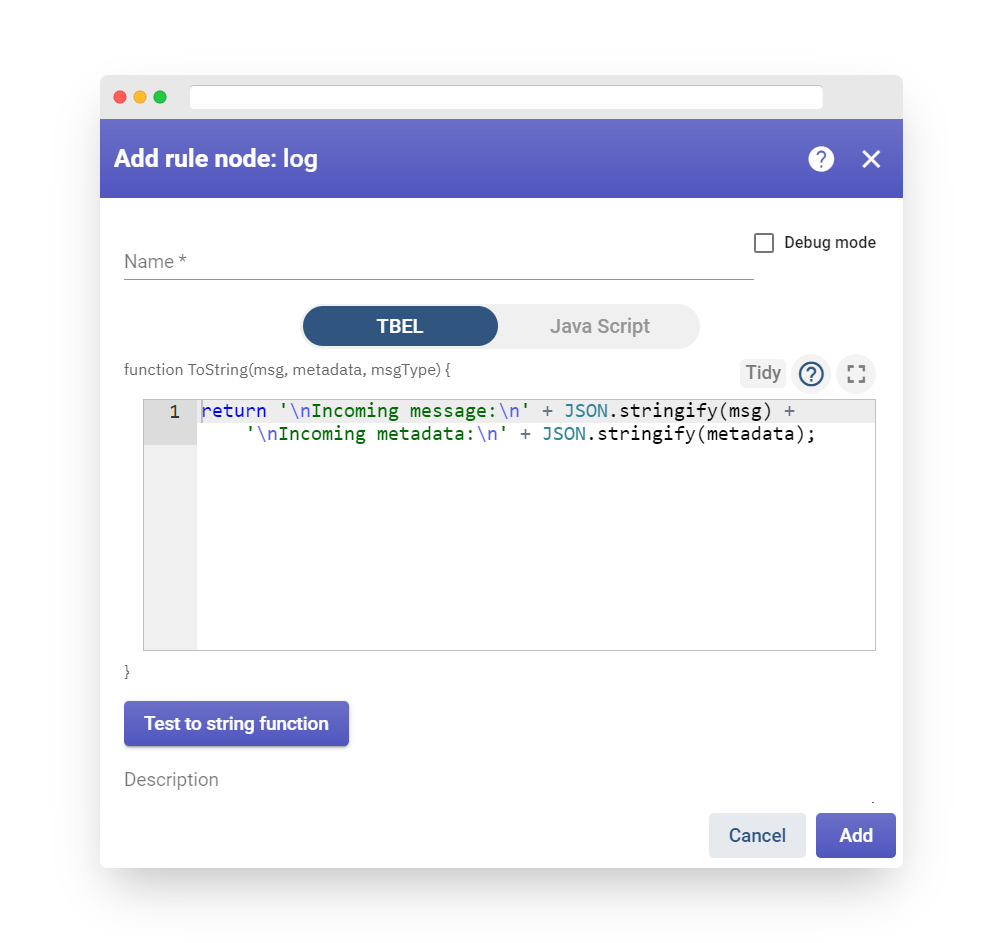
Fig. 5.2 – Add log
The JavaScript transform function can be tested using the Test JavaScript function.
#
RPC Call Reply Node #
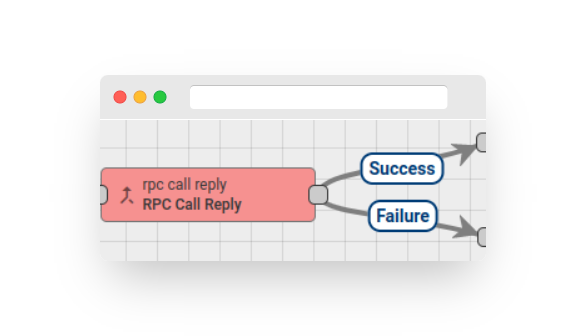
Fig. 6.1 – Rule node: RPC Call Reply
This node sends a response to the originator of an RPC call. All incoming RPC requests are passed through the rule chain as messages, and each RPC request has a request ID field that is used for mapping requests and responses. The message originator must be a device entity, as the RPC response is initiated to the message originator.
The node configuration includes a special request ID field mapping. If the mapping is not specified, the requestId metadata field is used by default.
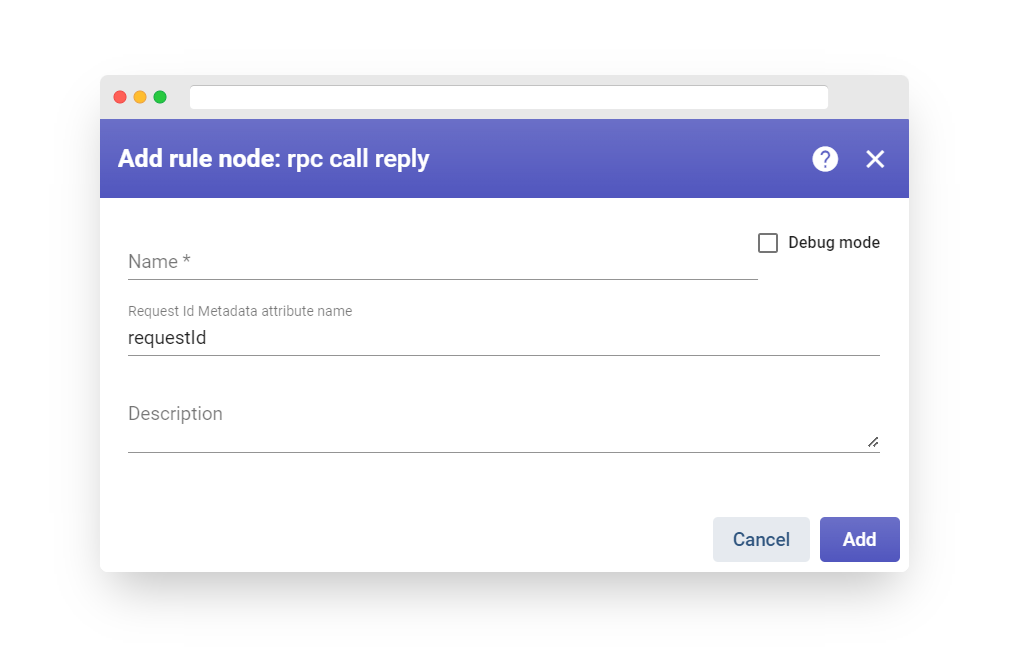
Fig. 6.2 – Add RPC Call Reply
RPC requests can be received via different transports, including MQTT, HTTP, and CoAP. An example of the message payload is as follows:
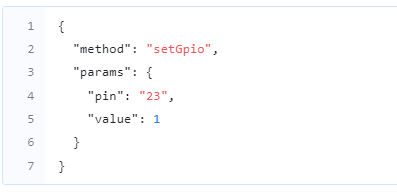
The message will be routed via the Failure chain in the following cases:
-
The inbound message originator is not a device entity.
-
The request ID is not present in the message metadata.
-
The inbound message payload is empty.
#
RPC Call Request Node #
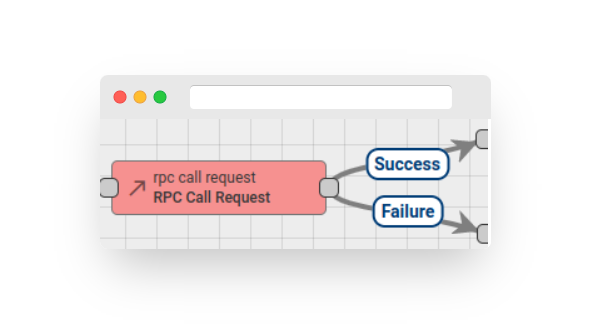
Fig. 7.1 – Rule node: RPC Call Request
This node sends RPC requests to the device and routes the response to the next rule nodes. The message originator must be a device entity, as an RPC request can only be initiated to a device.
The node configuration includes a Timeout field, which is used to specify the timeout waiting for a response from the device.

Fig. 7.2 – Add RPC Call Request
The message payload must have the correct format for an RPC request, which includes the method and params fields.
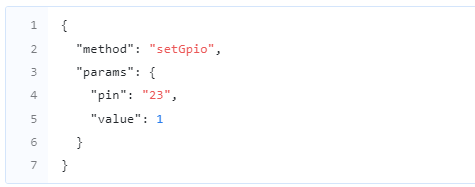
If the message payload contains the requestId field, its value will be used to identify the RPC request to the device. Otherwise, a random requestId will be generated.
The outbound message will have the same originator and metadata as the inbound message. The response from the device will be added to the message payload.
The message will be routed via the Failure chain in the following cases:
-
The inbound message originator is not a device entity.
-
The inbound message is missing the method or params fields.
-
If the node does not receive a response during the configured timeout.
Otherwise, the message will be routed via the Success chain.
Save Attributes Node #
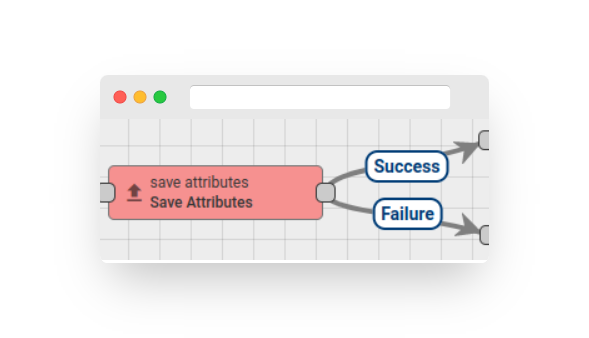
Fig. 8.1 – Rule node: save attributes
This node stores attributes from the incoming message payload to the database and associates them with the entity that is identified by the message originator. The configured scope is used to identify the attribute’s scope.
The following scope types are supported:
-
Client attributes
-
Shared attributes
-
Server attributes
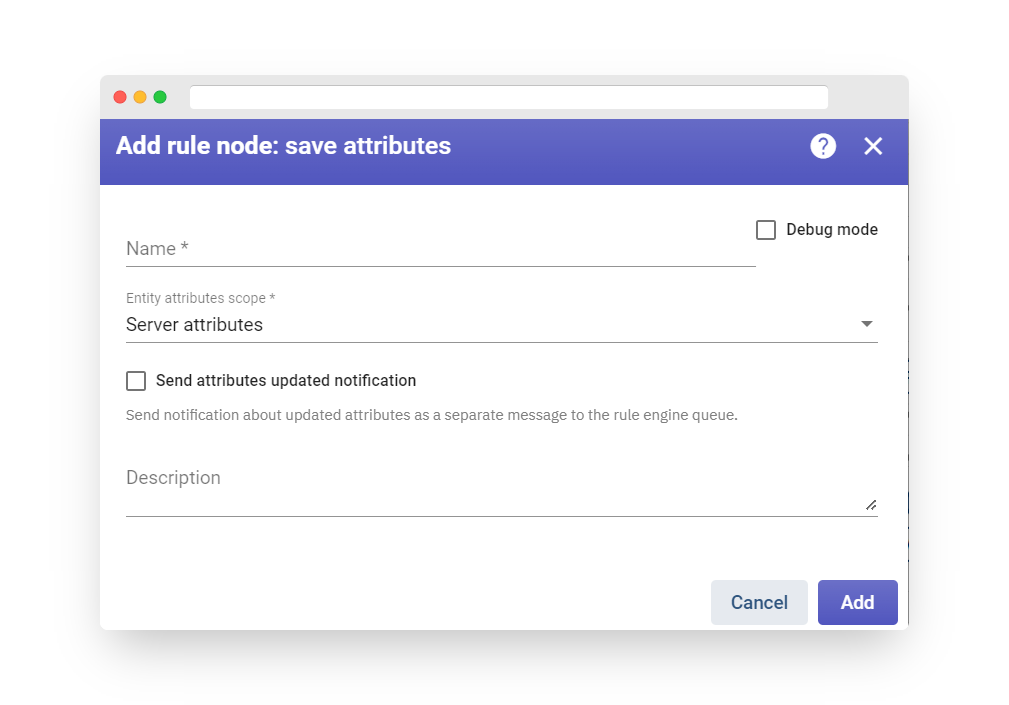
Fig. 8.2 – Add save attributes node
This node expects messages with the message type POST_ATTRIBUTES_REQUEST. If the message type is not POST_ATTRIBUTES_REQUEST, the message will be routed via the Failure chain.
When attributes are uploaded over an existing API such as HTTP, MQTT, CoAP, etc., a message with the correct payload and type will be passed into the input node of the root rule chain.
In cases where it is necessary to trigger attribute saving inside the rule chain, the rule chain should be configured to transform the message payload to the expected format and set the message type to POST_ATTRIBUTES_REQUEST. This can be done using the Script Transformation node.
An example of the expected message payload is as follows:
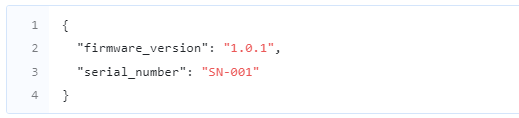
If the attributes saving is successful, the original message will be passed to the next nodes via the Success chain. Otherwise, the Failure chain will be used.
#
Save Timeseries Node #

Fig. 9.1 – Rule node: save timeseries
This node stores timeseries data from the incoming message payload to the database and associates them with the entity that is identified by the message originator. The configured time-to-live (TTL) value in seconds is used for timeseries data expiration. A value of 0 means that the data will never expire.
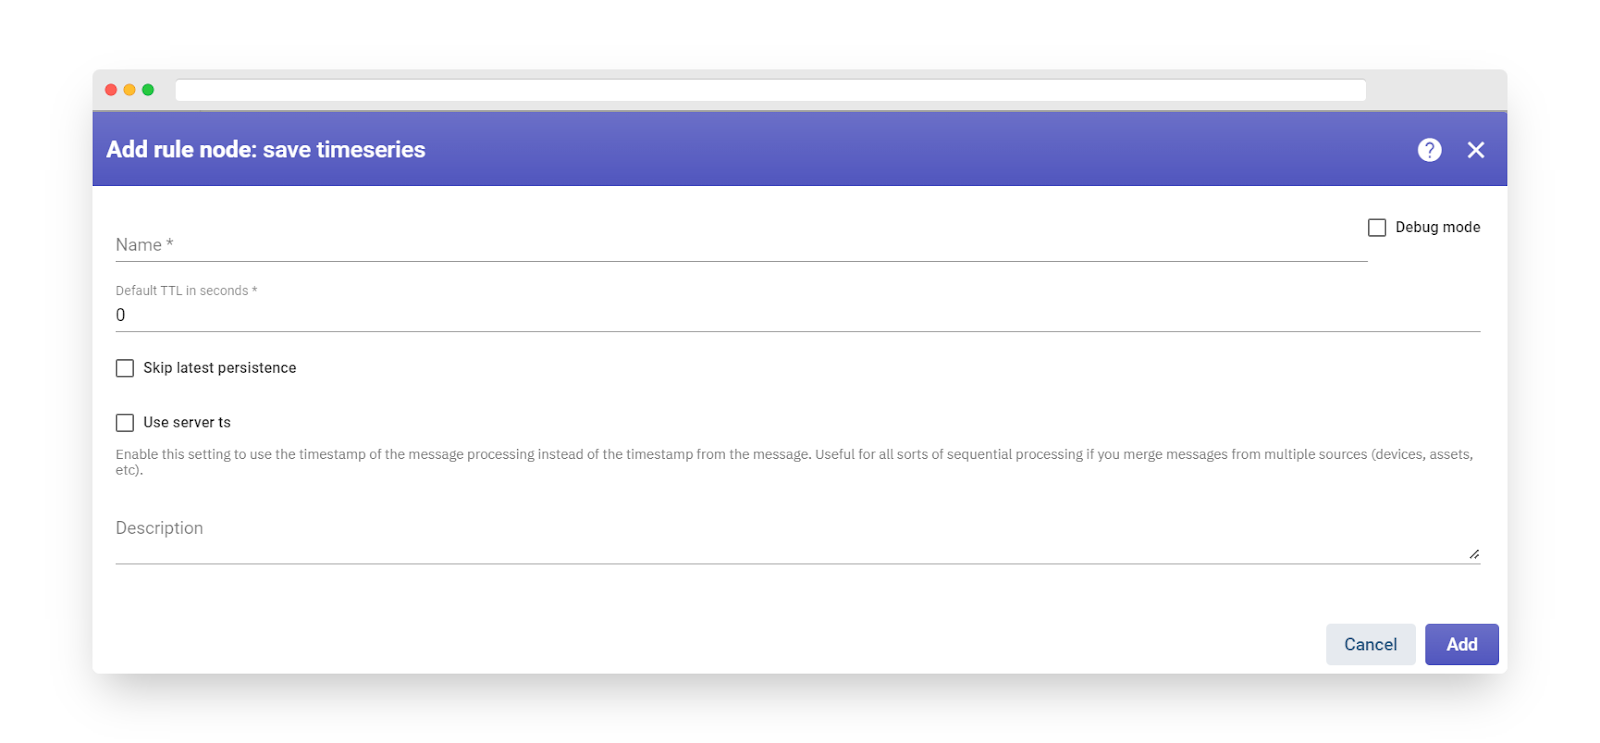
Fig. 9.2 – Add save timeseries node
Moreover, if the ‘Skip latest persistence’ flag is set to true, you can disable updating the values for incoming keys for the latest timeseries data in the ‘ts_kv_latest’ table. This can be useful for highly loaded use-cases to reduce the pressure on the database. However, please note that this feature should only be enabled if the use-case does not require advanced filtering on the dashboards. To obtain the latest value, the historical data can be fetched with a limit of 1 and in descending order.
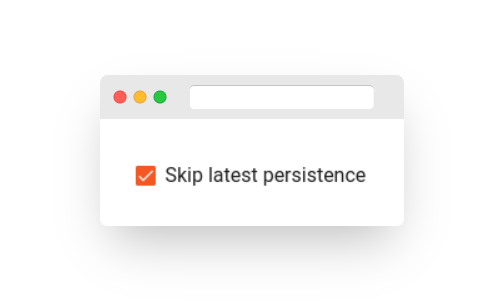
Fig. 9.3 – ‘Skip latest persistence’ flag
This node expects messages with the message type POST_TELEMETRY_REQUEST. If the message type is not POST_TELEMETRY_REQUEST, the message will be routed via the Failure chain.
When timeseries data is published over an existing API such as HTTP, MQTT, CoAP, etc., a message with the correct payload and type will be passed into the input node of the root rule chain.
In cases where it is necessary to trigger timeseries data saving inside the rule chain, the rule chain should be configured to transform the message payload to the expected format and set the message type to POST_TELEMETRY_REQUEST. This can be done using the Script Transformation node.
The message metadata must contain the ‘ts’ field, which identifies the timestamp in milliseconds of the published telemetry.
If the message metadata contains the ‘TTL’ field, its value will be used for timeseries data expiration. Otherwise, the TTL from the node configuration will be used.
You can enable the ‘useServerTs’ parameter to use the timestamp of message processing instead of the timestamp from the message. This is useful for all sorts of sequential processing if you merge messages from multiple sources (devices, assets, etc).
In the case of sequential processing, the platform guarantees that the messages are processed in the order of their submission to the queue. However, the timestamp of the messages originated by multiple devices/servers may be unsynchronized long before they are pushed to the queue. The DB layer has certain optimizations to ignore the updates of the ‘attributes’ and ‘latest values’ tables if the new record has a timestamp that is older than the previous record.
To ensure that all messages are processed correctly, one should enable this parameter for sequential message processing scenarios.
An example of the expected message payload is as follows:
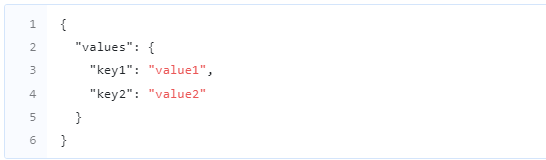
If the timeseries data saving is successful, the original message will be passed to the next nodes via the Success chain. Otherwise, the Failure chain will be used.
Save to Custom Table #
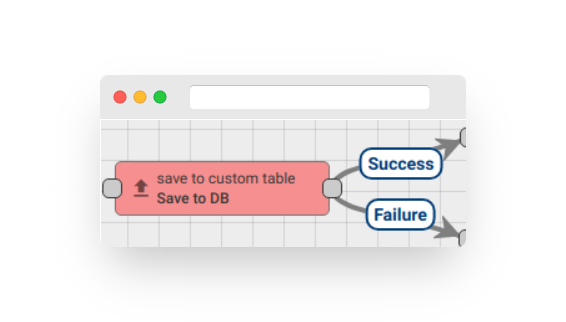
Fig. 10.1 – Rule node: save to custom table
This node stores data from the incoming message payload to a custom Cassandra database table that should have the ‘cs_tb_’ prefix to avoid inserting data into the common TB tables.
Please note that this rule node can only be used for Cassandra DB.
Configuration:
The administrator should set the custom table name without the ‘cs_tb_‘ prefix.
The administrator can configure the mapping between the message field names and table column names. If the mapping key is ‘$entityId’, which is identified by the message originator, then the appropriate column name (mapping value) will be used to write the message originator ID.
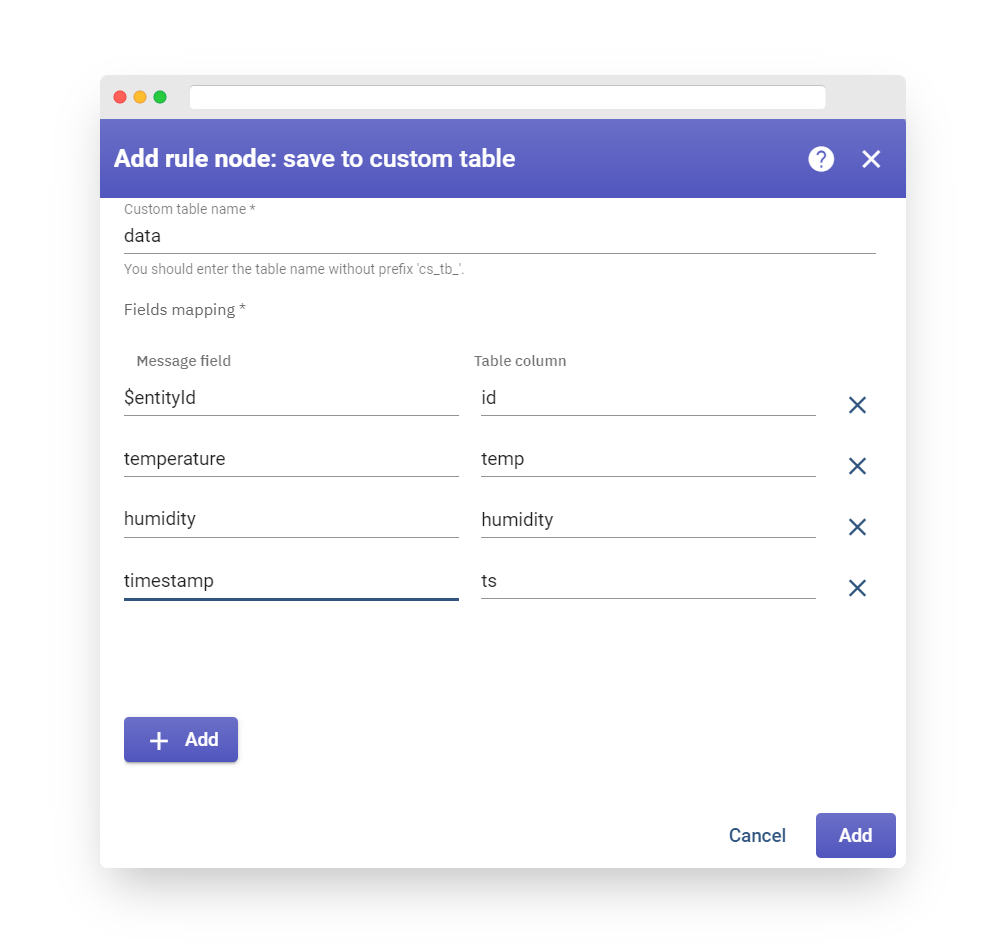
Fig. 10.2 – Add save to custom table node
If a specified message field does not exist in the message data or is not a JSON primitive, the outbound message will be routed via the Failure chain. Otherwise, the message will be routed via the Success chain.
Note: Please ensure that you are not using metadata keys in the configuration, as only data keys are supported.
Assign To Customer Node #
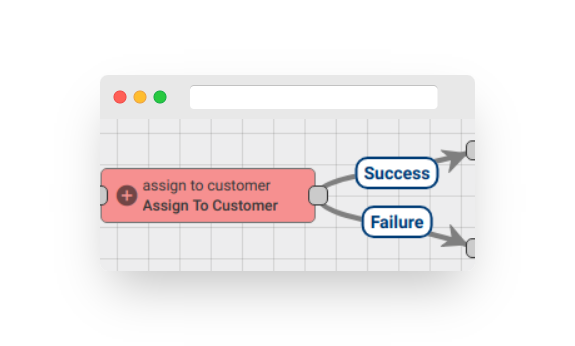
Fig. 11.1 – Rule node: assign to customer
Assign the message originator entity to a customer.
The following message originator types are allowed: Asset, Device, Entity View, and Dashboard.
The node will find the target customer by the customer name pattern and assign the originator entity to this customer. If the customer doesn’t exist, it will create a new one if the ‘Create new customer if not exists’ setting is enabled.
Configuration:
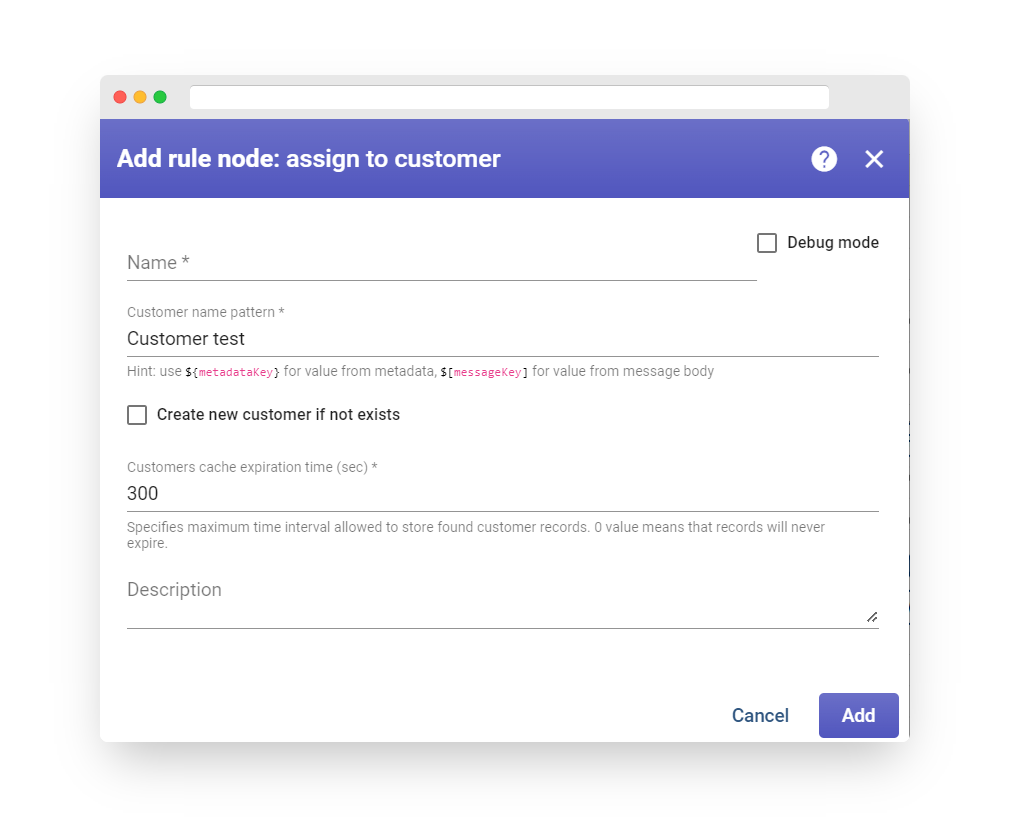
Fig. 11.2 – Add assign to customer node
-
“Customer name pattern” can be set to either a direct customer name or a pattern that will be resolved to the real customer name using message metadata.
-
“Create new customer if not exists” will create a new customer if it doesn’t already exist, if checked.
-
“Customers cache expiration time” specifies the maximum time interval, in seconds, allowed to store found customer records. A value of 0 means that records will never expire.
The message will be routed via the Failure chain in the following cases:
-
When the originator entity type is not supported.
-
The target customer doesn’t exist and “Create customer if not exists” is unchecked.
In all other cases, the message will be routed via the Success chain.
Unassign From Customer Node #
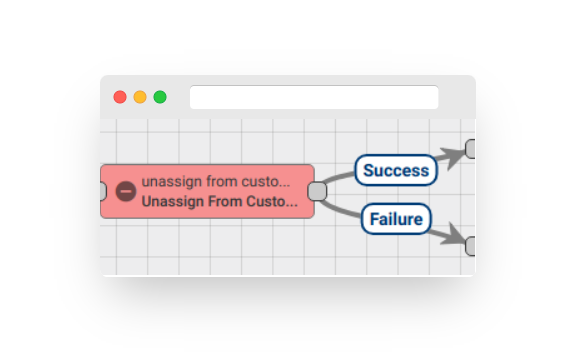
Fig. 12.1 – Rule node: unassign from customer node
Unassign the message originator entity from a customer.
The following message originator types are allowed: Asset, Device, Entity View, and Dashboard.
The node will find the target customer by the customer name pattern and unassign the originator entity from this customer.
Configuration:
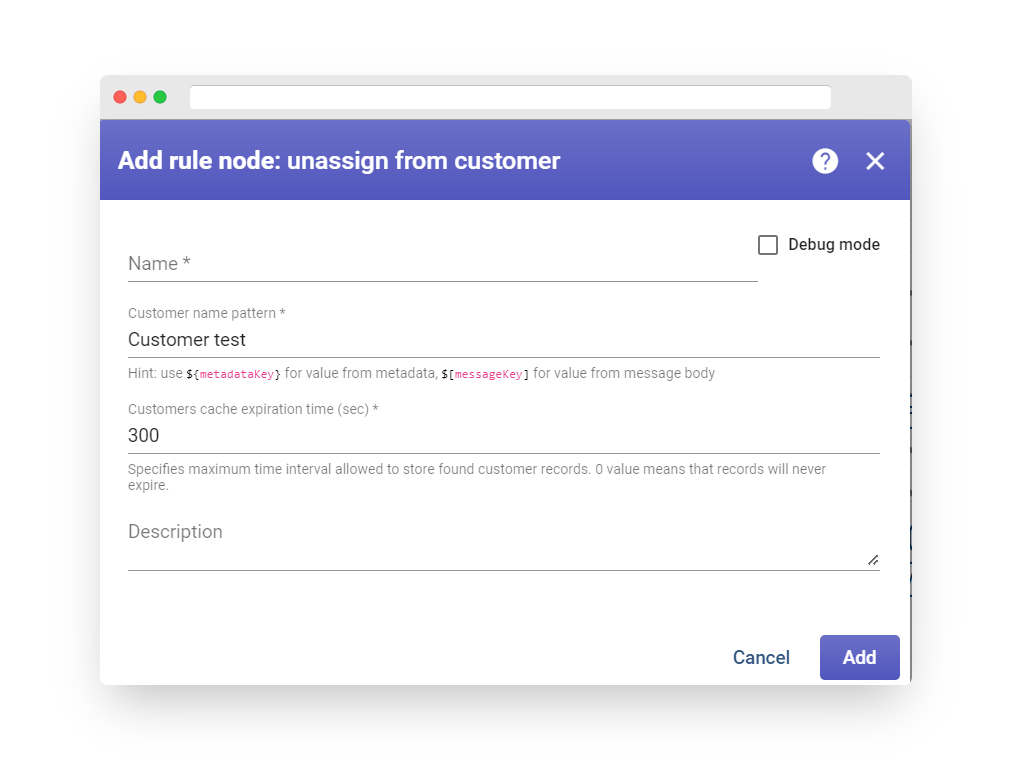
Fig. 12.2 – Add unassign from customer
-
“Customer name pattern” can be set to either a direct customer name or a pattern that will be resolved to the real customer name using message metadata.
-
“Customers cache expiration time” specifies the maximum time interval, in seconds, allowed to store found customer records. A value of 0 means that records will never expire.
The message will be routed via the Failure chain in the following cases:
-
When the originator entity type is not supported.
-
The target customer doesn’t exist.
In all other cases, the message will be routed via the Success chain.
Create Relation Node #

Fig. 13.1 – Rule node: create relation
This node creates a relation from the selected entity to the originator of the message by type and direction.
The following message originator types are allowed: Asset, Device, Entity View, Customer, Tenant, and Dashboard.
The node finds the target entity by metadata key patterns and then creates a relation between the originator entity and the target entity.
If the selected entity type is Asset, Device, or Customer, the rule node will create a new entity if it doesn’t already exist and if the “Create new Entity if not exists” checkbox is selected.
Note: If the selected entity type is Asset or Device, you need to set two patterns: the entity name pattern and the entity type pattern. Otherwise, only the name pattern needs to be set.
Configuration:
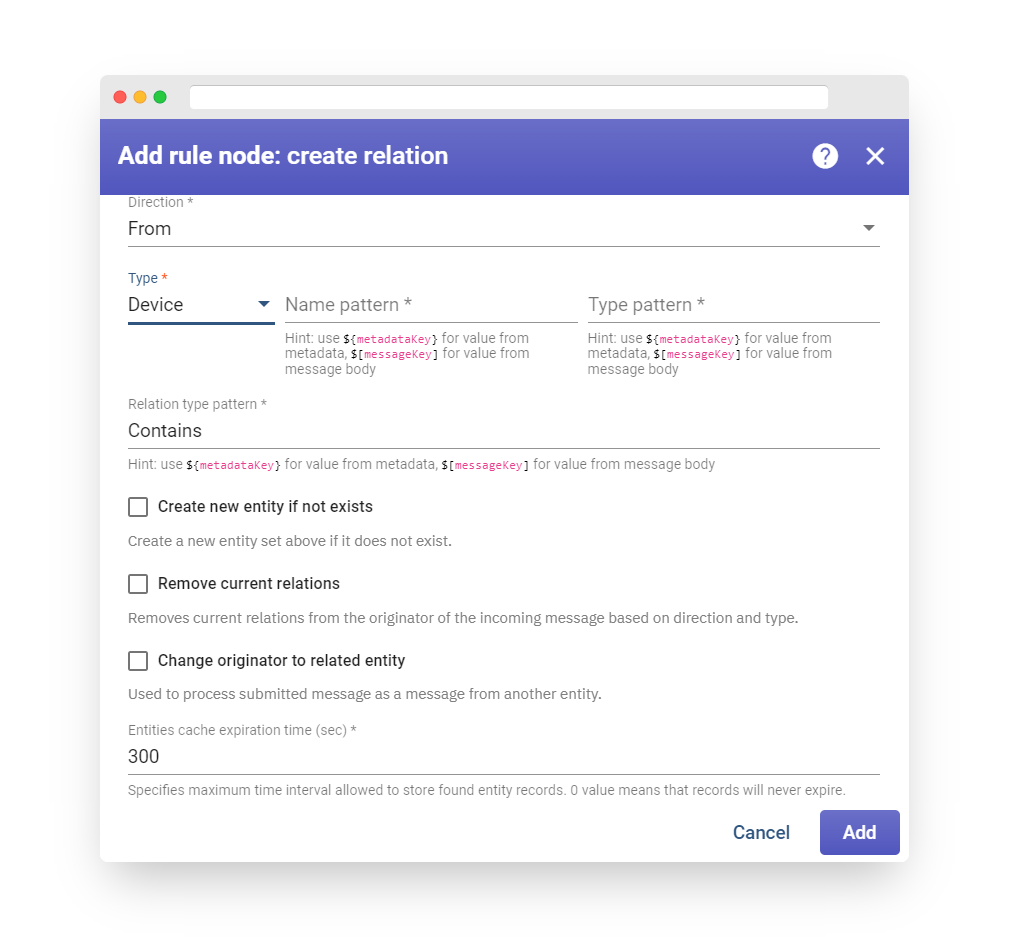
Fig. 13.2 – Add create relation node
-
“Direction” allows for two types: “From” and “To.”
-
“Relation type” determines the type of directed connections to the message originator entity. Default types “Contains” and “Manages” can be selected from the drop-down list.
-
“Name pattern” and “Type pattern” can be set to either a direct entity name/type or a pattern that will be resolved to the real entity name/type using message metadata.
-
“Entities cache expiration time” specifies the maximum time interval, in seconds, allowed to store found target entity records. A value of 0 means that records will never expire.
The message will be routed via the Failure chain in the following cases:
-
When the originator entity type is not supported.
-
The target entity doesn’t exist.
In all other cases, the message will be routed via the Success chain.
Note: The rule node can:
-
Remove current relations from the originator of the incoming message based on direction and type.
-
Change the originator of the incoming message to the selected entity and process outbound messages as messages from another entity.
Delete Relation Node #
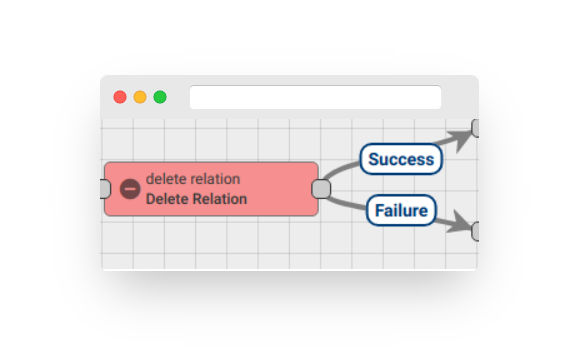
Fig. 14.1 – Rule node: delete relation
This node deletes the relation from the selected entity to the originator of the message by type and direction.
The following message originator types are allowed: Asset, Device, Entity View, Customer, Tenant, and Dashboard.
The node finds the target entity by entity name pattern and then deletes the relation between the originator entity and this entity.
Configuration:
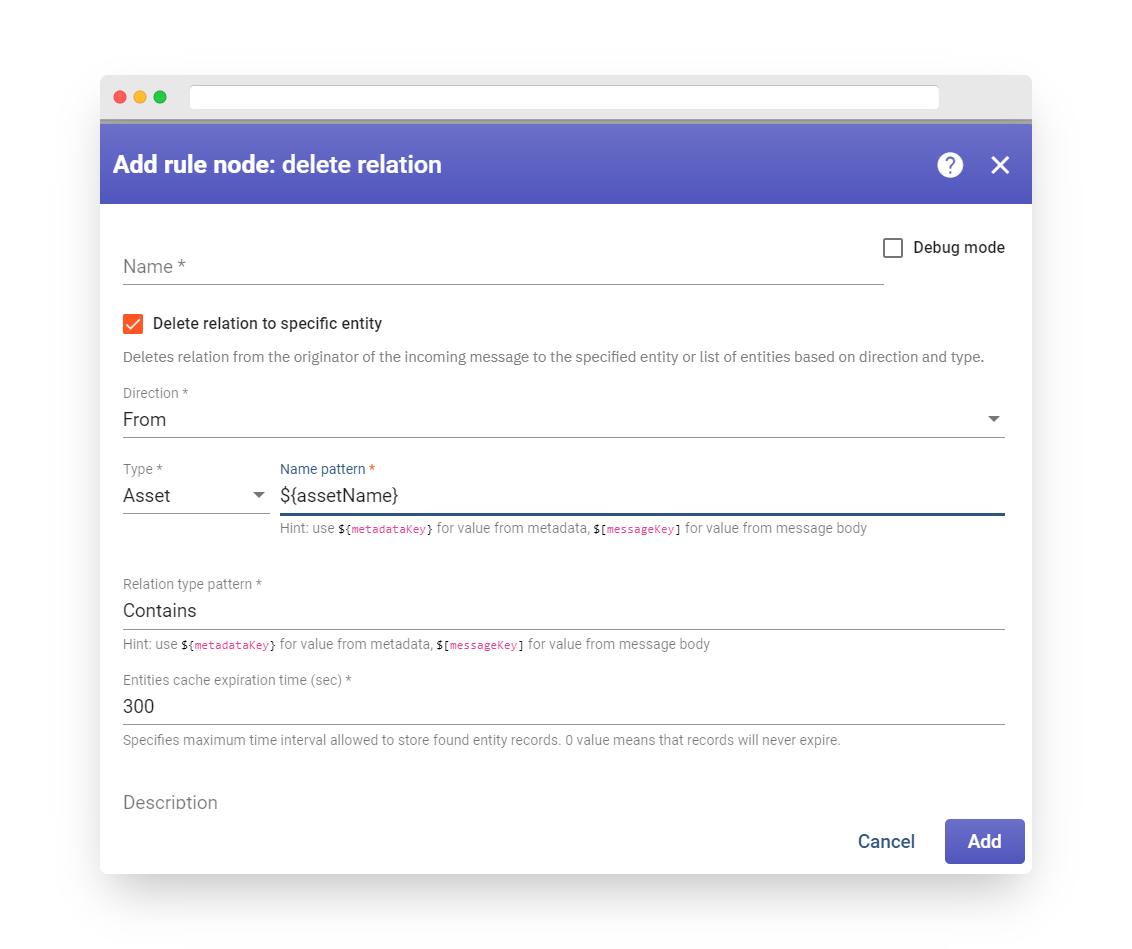
Fig. 14.2 – Add delete relation node
-
“Direction” allows for two types: “From” and “To.”
-
“Relation type” determines the type of directed connections to the message originator entity. Default types “Contains” and “Manages” can be selected from the drop-down list.
-
“Name pattern” can be set to either a direct entity name or a pattern that will be resolved to the real entity name using message metadata.
-
“Entities cache expiration time” specifies the maximum time interval, in seconds, allowed to store found target entity records. A value of 0 means that records will never expire.
The message will be routed via the Failure chain in the following cases:
-
When the originator entity type is not supported.
-
The target entity doesn’t exist.
In all other cases, the message will be routed via the Success chain.
Note: The rule node has the ability to delete the relation from the originator of the incoming message to the specified entity or to the list of entities based on direction and type by disabling the following checkbox in the rule node configuration: “Delete relation only with specified entities”.
GPS Geofencing Events Node #
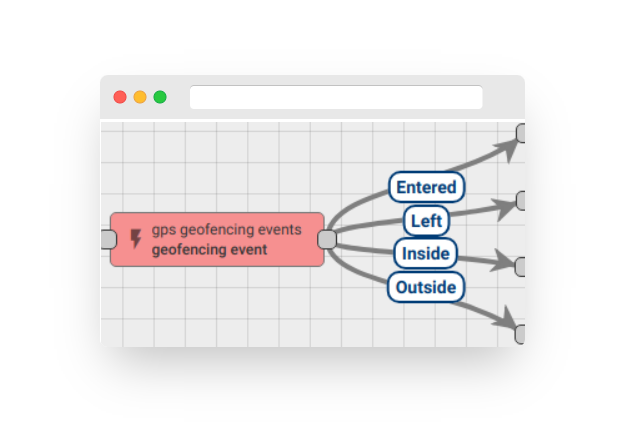
Fig. 15.1 – Rule node: GPS Geofencing Events
This node generates incoming messages based on GPS-based parameters. It extracts latitude and longitude from incoming message data or metadata and returns different events based on configuration parameters related to geofencing.
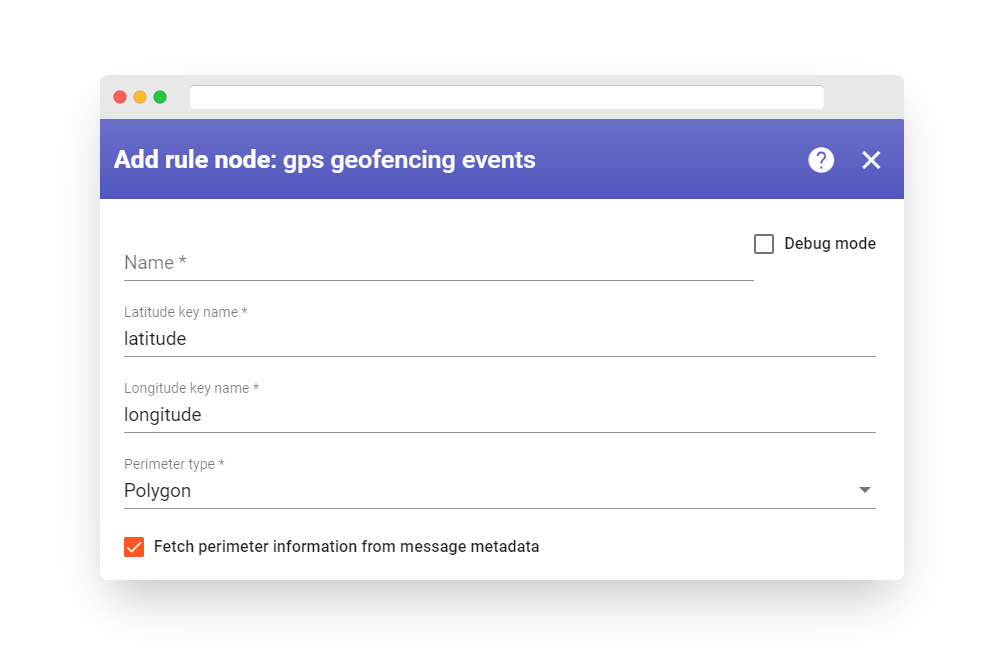
Fig. 15.2 – Add gps geofencing events node
By default, the rule node retrieves perimeter information from message metadata. However, if the option “Fetch perimeter information from message metadata” is unchecked, additional information must be configured.
Fetch perimeter information from message metadata
Perimeter type determines the two options available for defining an area: Polygon and Circle.
The incoming message’s metadata must contain a key with the name ‘perimeter’ and the following data structure:
-
Polygon
-
Circle
The keys “latitude” and “longitude” represent the coordinates of a point.
The “radius” key indicates the distance from the coordinate point to the circle.
All values for these keys must be in the double-precision floating-point data type.
The “radiusUnit” key must have a specific value from a list that includes METER, KILOMETER, FOOT, MILE, NAUTICAL_MILE (capital letters are mandatory).
Retrieve perimeter information from node configuration
Two options are available for defining an area based on the perimeter type:
-
Polygon
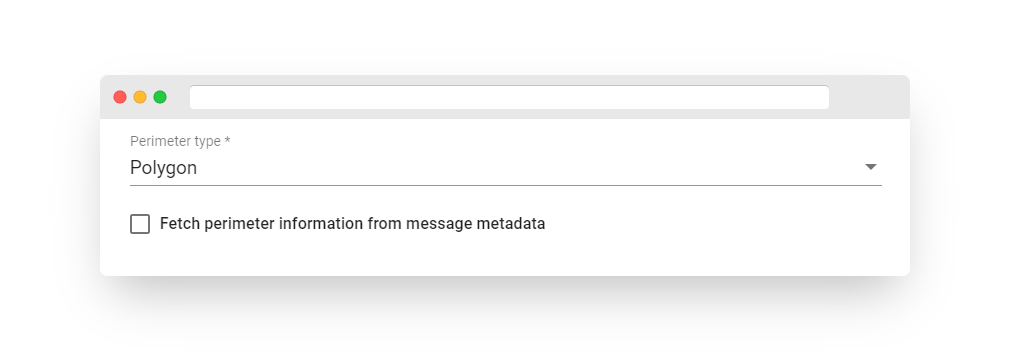
Fig. 15.3 – Polygon perimeter type
-
Circle
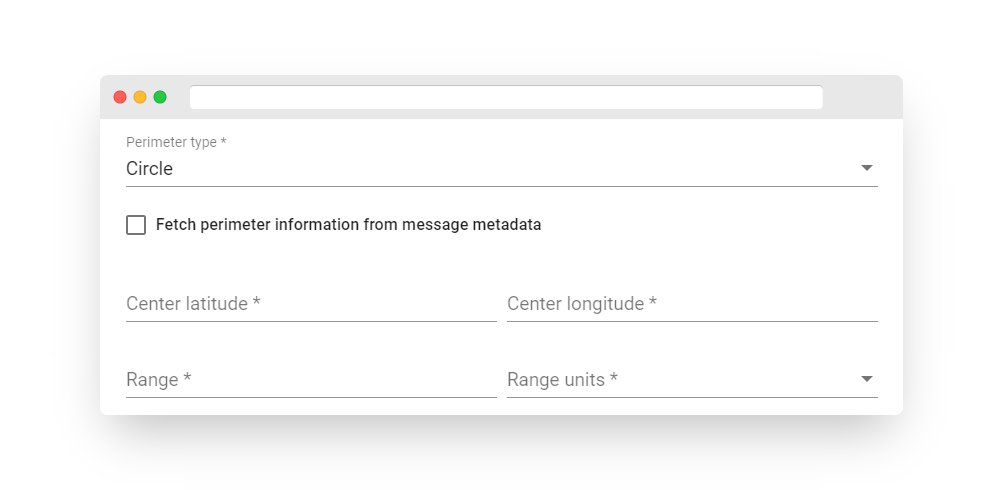
Fig. 15.4 – Circle perimeter type
Event Types:
The geofencing rule node manages four types of events:
-
Entered – reported when the latitude and longitude from the incoming message first belong to the required perimeter area.
-
Left – reported when the latitude and longitude from the incoming message no longer belong to the required perimeter area for the first time.
-
Inside and Outside events are used to report the current status.
The administrator can configure the duration time threshold for reporting inside or outside events. For instance, if the minimum inside time is set to 1 minute, the message originator is considered to be inside the perimeter 60 seconds after entering the area. The minimum outside time determines when the message originator is considered out of the perimeter.
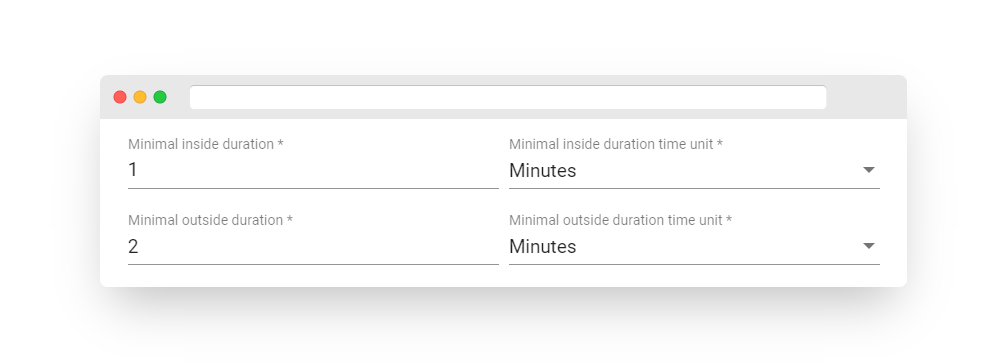
Fig. 15.5 – The administrator can configure the duration time threshold for reporting inside or outside events.
The failure chain will be triggered in the following situations:
-
When the incoming message does not contain a latitude or longitude key in either its data or metadata.
-
When the perimeter definition is missing.
Push to cloud #
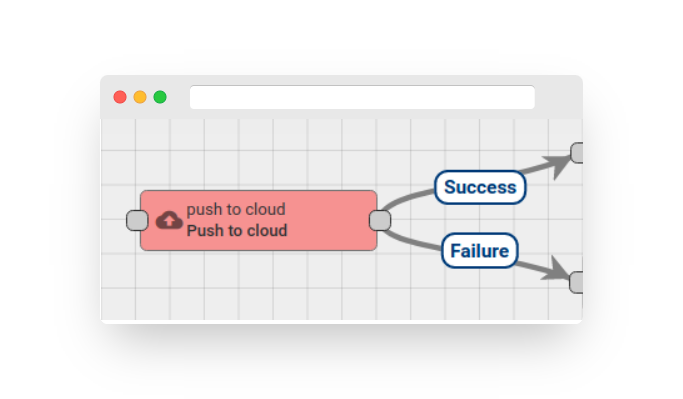
Fig. 16.1 – Rule node: push to cloud
This node is designed to push messages from the edge to the cloud. It can only be used on the edge for this purpose. When a message is received by this node, it is converted into a cloud event and saved to the local database. The node does not push messages directly to the cloud, but rather stores the event(s) in the cloud queue. The following originator types are supported:
-
DEVICE
-
ASSET
-
ENTITY_VIEW
-
DASHBOARD
-
TENANT
-
CUSTOMER
-
EDGE
Additionally, the following message types are supported by the node:
-
POST_TELEMETRY_REQUEST
-
POST_ATTRIBUTES_REQUEST
-
ATTRIBUTES_UPDATED
-
ATTRIBUTES_DELETED
-
ALARM
If the edge event is successfully stored in the database, the message will be routed through the Success route.
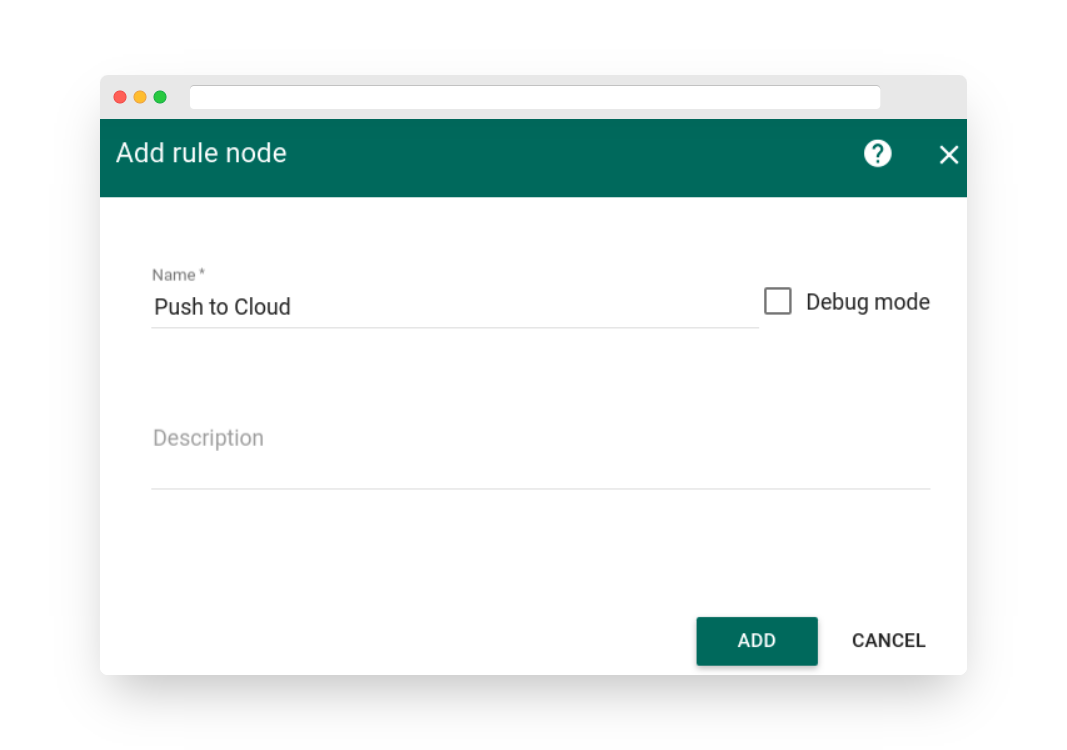
Fig. 16.2 – Add push to cloud node
The message will be directed to the Failure chain in the following situations:
-
The node was unable to save the edge event to the database.
-
An unsupported originator type has been received.
-
An unsupported message type has been received.
Push to edge #
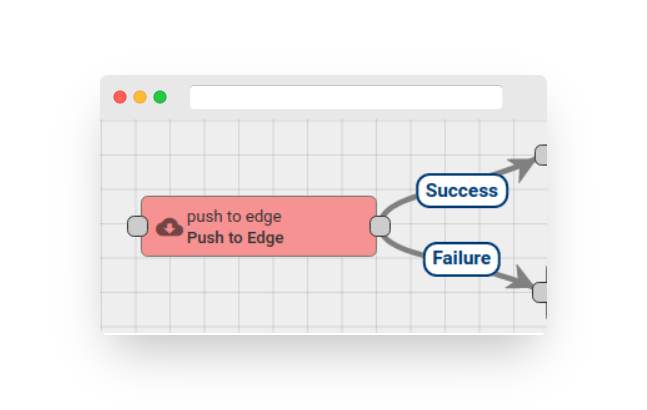
Fig. 17.1 – Rule node: push to edge
This node is used on cloud instances to push messages from the cloud to the edge. The message originator must be assigned to a particular edge, or the message originator itself must be the EDGE entity. When a message is received by this node, it is converted into an edge event and saved to the database. The node does not push messages directly to the edge, but rather stores the event(s) in the edge queue. The following originator types are supported:
-
DEVICE
-
ASSET
-
ENTITY_VIEW
-
DASHBOARD
-
TENANT
-
CUSTOMER
-
EDGE
Additionally, the following message types are supported by the node:
-
POST_TELEMETRY_REQUEST
-
POST_ATTRIBUTES_REQUEST
-
ATTRIBUTES_UPDATED
-
ATTRIBUTES_DELETED
-
ALARM
If the edge event is successfully stored in the database, the message will be routed through the Success route.
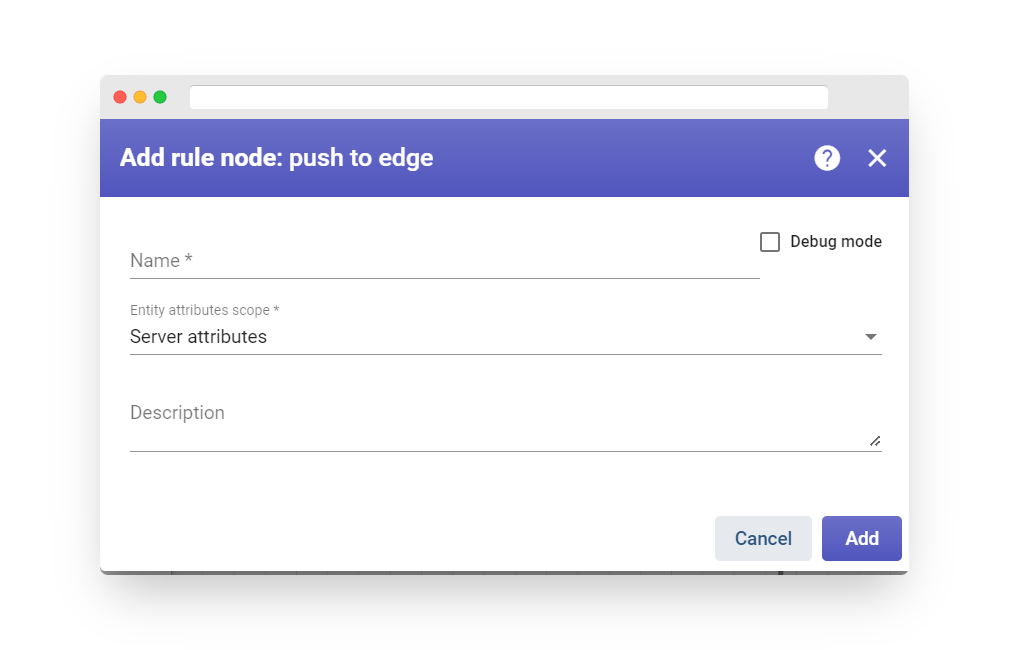
Fig. 17.2 – Add push to edge node
The message will be routed through the Failure chain in the following cases:
-
The node was unable to save the edge event to the database.
-
An unsupported originator type has been received.
-
An unsupported message type has been received.
Tenants #
Fast IoT Platform supports Multitenancy out-of-the-box, allowing you to treat a Fast IoT Platform tenant as a separate business entity, whether an individual or organization that owns or produces devices.
The system administrator has the ability to create tenant entities.
Fig. 1 – Tenant page
The system administrator can also create multiple users with the Tenant Administrator role for each tenant by clicking the “Manage Tenant Admins” button in the Tenant details.
Fig. 2 – Tenant details page.
The Tenant Administrator can perform the following actions:
-
Provision and manage devices.
-
Provision and manage assets.
-
Create and manage customers.
-
Create and manage dashboards.
-
Configure the Rule Engine.
-
Add or modify default widgets using the Widget Library.
All of the actions listed above are available through the REST API.
Adding a Tenant #
To add a new tenant, please follow these instructions:
-
Go to the menu on the left and select “Tenants”.
-
Click on the plus icon to add a new tenant.
Fig. 3.1 – Tenant page
Once the window opens, you will be able to edit all of the tenant information. It is important to fill in the title and tenant profile fields. Additionally, you may choose to include the tenant’s country, city, address, phone number, and email address.
Fig. 3.2 – Add tenant
As the system administrator, you have access to the tenant details page where you can view attributes, the latest telemetry, assign the home dashboard, and copy the tenant ID.
Fig. 3.3 – Tenant management
Adding a Tenant Administrator #
The system administrator has the ability to create multiple users with the Tenant administrator role within each tenant.
To add a Tenant administrator, please follow these instructions:
-
Click on the tenant you created.
-
Click on “Manage tenant admins”.
-
Click on the plus icon to add a new user.
Fig. 4 – Adding a tenant administrator
After creating a new user, the system administrator can edit their details and use the following action tabs:
-
“Disable User Account” to disable the user account.
-
“Display Activation Link” to show the activation link for the Tenant administrator user.
-
“Resend Activation” to resend the account activation email to the user’s email.
-
“Login as Tenant Administrator” to access the Thingsboard platform from the Tenant administrator UI.
-
The system administrator also has the ability to delete users from both the user details page and the tenant admins list.
Login as a Tenant Administrator #
If necessary, you can log in as the Tenant administrator to view the user interface from their perspective. To do this, you need to open the Tenant Admins list and click on the arrow opposite the user account.
Fig. 5 – Login as the tenant admin.
The Tenant Administrator has the authority to perform the following tasks:
-
Provision and manage devices.
-
Provision and manage assets.
-
Create and manage customers.
-
Create and manage dashboards.
-
Configure the rule engine.
-
Add or modify default widgets using the Widget Library.
-
All of the actions mentioned above can be carried out using the REST API.
Deleting a Tenant #
Furthermore, there is a possibility to delete the Tenant by selecting the “action” tab located in the Tenant details window.
Fig. 6 – Deleting a tenant
As an alternative, you can delete the required Tenant along with all its users directly from the Tenants list.
In addition, you can easily delete the Tenant along with all of its users from the list of Tenants by clicking on the trash can icon.
Tenant Profiles #
Overview #
The System Administrator can configure common settings for multiple tenants by using Tenant Profiles. Each tenant has only one profile at a single point in time.
Let’s go through the settings available in the tenant profile one by one.
Entity Limits #
This group of settings allows the System Administrator to configure a maximum number of entities that each Tenant is able to create.
Fast IoT Platform supports limits for the following entities: devices, assets, customers, users, dashboards, and rule chains.
Fig. 1 – Tenant profile details
API Limits & Usage #
This group of settings allows the System Administrator to configure the maximum number of messages, API calls, etc., per month that each tenant can perform. Fast IoT Platform continuously collects and analyzes statistics on API usage, with typical updates every minute.
Fast IoT Platform tracks API usage for six main components: Transport, Rule Engine, JS Functions, Telemetry Persistence, Email, and SMS Services. The platform will disable a component if one of the related API Limits reaches a threshold. For example, if a tenant’s devices produce more than 100 million messages per month, the platform will disable all connections for devices belonging to that tenant. When API usage is disabled or reaches a certain threshold (typically 80%), Fast IoT Platform will notify the Tenant Administrator via email.
Let’s review each limit separately:
Transport Messages refer to any message sent from a device to the server. This could be telemetry data, attribute updates, RPC calls, and so on.
Transport Data Points refer to the number of key-value pairs contained within telemetry or attribute messages. For example, the message listed below contains 5 data points because “jsonKey” corresponds to one data point.
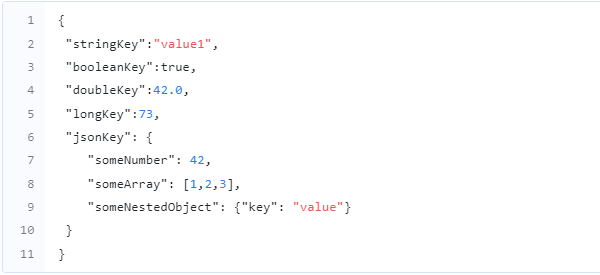
If a String or JSON key has a value larger than 512 characters, the platform will count it as multiple data points.
Rule Engine executions refer to every time a rule node belonging to the current Tenant is executed. A single telemetry message may trigger multiple Rule Engine executions, and periodic messages from Generator nodes are also counted.
JavaScript executions refer to every time a custom function defined by Tenant Administrators is executed. This includes processing of the “Script” filter, a transformation node, and invocation of the data converter.
Data points storage days are calculated by multiplying the number of data points by the number of days those data points will be stored in the database. The TTL parameter is used to extract the number of days to store the data. For example, if you store 3 data points for 30 days, this is 90 storage data point days. The “Default Storage TTL Days” parameter in the tenant profile can be used to configure default TTL, while the Tenant Administrator can overwrite default TTL using the “Save Timeseries” rule node configuration or the “TTL” parameter in the post telemetry request.
Alarms TTL refers to the number of days to store alarms in the database.
Alarms sent is the total number of alarms created per period (one month by default).
Emails sent refers to the number of emails sent from the rule engine using system SMTP provider (settings). Tenant Administrators can define custom SMTP settings in both Community and Professional Editions of the platform. Emails sent with custom SMTP settings do not affect API limits.
SMS sent refers to the number of SMSes sent from the rule engine using the system SMS provider. Tenant Administrators can define custom SMS provider settings in both Community and Professional Editions of the platform. SMS sent with custom SMTP settings do not affect API limits.
API Usage dashboard #
As a Tenant Administrator, you have access to the API Usage dashboard, which provides information about your hourly, daily, and monthly API usage. This dashboard enables you to quickly review the status of API limits.
Fig. 2 – Api usage page
Rate Limits #
This set of configurations enables a System Administrator to set the maximum number of requests that the platform should handle for a particular device (device-level) or for all devices associated with a single tenant (tenant-level). The rate limits are implemented using the token bucket algorithm.
The rate limit definition includes a value and a time interval. For instance, “1000:60” indicates that no more than 1000 messages should be processed in a 60-second interval. Multiple intervals can be defined using commas. For example, “100:1,1000:60” means that the system can handle bursts of 100 messages per second, but no more than 1000 times per 60 seconds.
Fig. 3 Rate limits
Customers #
Overview #
A customer refers to an individual, organization, or separate business entity that either purchases or uses tenant devices and assets. This customer could potentially have millions of devices and assets and multiple users associated with them.
Adding a Customer #
If you are a Tenant administrator, you can add a new customer by following these steps:
-
Go to the menu on the left side and choose Customers.
-
To open a new item, click on the plus icon positioned on the top right corner of the screen.
Fig. 1 – Customers page
-
After the window appears, type in the Customer’s title. You may also provide additional information such as the country name, city, address, and phone number. To save the newly created Customer’s data, press the Add button.
Fig. 2 – Customer’s data
-
By clicking on the corresponding tab, the Tenant administrator can directly oversee users, assets, devices, dashboards, and edges from the Customer details page. Additionally, the Tenant administrator can copy the customer ID from these details. To modify any of the information, simply click on the pencil icon.
As depicted below, the Tenant can also assign the home dashboard and choose whether or not to display the toolbar in the Customer details window.
For further assistance, click the Question mark located at the upper right corner to access the user guide.
Fig. 3 – Customer details window.
To allocate assets to a Customer, click on Manage assets. Select the desired asset from the entity list and click on Assign. All the allocated assets will become visible to the Customer.
To allocate devices to a Customer, click on Manage devices. Select the device from the Entity drop-down list and click on Assign. All the allocated devices will become visible to the Customer.
To allocate a dashboard to a Customer, click on Manage dashboard. Select the dashboard from the Entity list and click on Assign. All the allocated dashboards will become visible to the Customer.
To allocate edges to a Customer, click on Manage edges. Select the edge from the entity list and click on Assign. All the allocated edges will become visible to the Customer.
The Tenant administrator can delete a Customer in one of the following ways:
-
Click on the Delete customer tab located on the Customer details page.
Fig. 4 – Delete customer
-
Click on the Trash Can icon located on the Customers list, as depicted in the image below.
Fig. 5 – Delete customer
As a Tenant administrator, you have the ability to add one or multiple Customers and Customer Users. Additionally, you can assign different devices and dashboards to Customer users and provide them with specific viewing permissions.
NOTE: Deleting the Customer will result in the loss of all data associated with that role, as well as the level itself.
Adding a Customer User #
To add a Customer User, go to the Manage users tab and click on the plus icon to create a new user.
Fig. 6 – Adding a customer user
Learn more about the Customer user creation process here.
Users #
Overview #
The Fast IoT Platform platform has three levels of roles, each with the ability to create users:
-
System administrator: This role can create a Tenant administrator user.
-
Tenant administrator: This role can create a Customer user.
-
Customer user: This role has read permissions to view dashboards and other entities assigned by the Tenant administrator. However, the Customer user cannot create any customers or subcustomers on their own.
Below are instructions on how to add a user at each level.
System administrator #
If you are the System administrator, you can create a user in a Tenant by following these steps:
-
Navigate to the Tenant admins section within the Tenants menu on the left, and add a new user by clicking the plus icon.
Fig. 1.1 – Tenant admins page
-
In the Add User window, provide the email address and choose the activation method. Optionally, the system administrator can include a name and description. Finally, click on the Add button.
Fig. 1.2 – Add user page
-
To use the activation link method, copy the link by clicking the arrow and paste it into a browser or messenger used by the user; an example of an activation link is provided below.
Fig. 1.3 – User activation link.
-
If you have chosen to send the activation email option, check your email inbox for the message regarding the activation of your Fast IoT Platform account, click on “Activate Your Account,” and follow the simple process to create a password.
Note: Prior to receiving an email from Fast IoT Platform, it is necessary to establish a mail server at the system administrator level. You may refer to the mail settings instructions for guidance.
Once a user is created, the system administrator can utilize the action tabs on the tenant details page, which include the following options:
-
Disabling the user account
-
Displaying the activation link for the Tenant administrator user
-
Resending the account activation email to the user’s email box
-
Logging in as the Tenant administrator to access the Fast IoT Platform platform from the Tenant administrator UI
-
Deleting the Tenant administrator from the tenants’ users list is also an option for the System Administrator.
Fig. 2.1 – User details
If the admin selects Disable User Account, a message will appear in the top left corner confirming that the user account has been successfully disabled. Additionally, the tab will change to Enable User Account. Please refer to the picture below for further clarification.
Fig. 2.2 – Disable user account
When a user with a disabled account attempts to access the platform, they will encounter the following error message.
Fig. 2.3 – Disabled account
Likewise, when the admin selects Enable User Account, a message will appear in the top left corner indicating that the user account has been successfully enabled. The tab will change to Disable User Account. Please refer to the picture below for further clarification.
Fig. 2.4 – Enable user account.
Tenant administrator #
To add a new user as a Tenant administrator, you can follow these steps:
-
Access the Customers section, proceed to Customer Users, and click on the plus icon to create a new user.
Fig. 3.1 – Customer users page.
-
Make sure to provide the email address and choose the activation method in the Add User window. The Tenant administrator can also add a name and description if desired. Once all the necessary information is entered, click on Add.
Fig. 3.2 – Add user
-
After creating the user, the Tenant Administrator can utilize the action tabs available on the user details page.
The available action tabs on the user details page are:
-
“Disable User Account” – this option was previously explained and allows the Tenant Administrator to disable the user account.
-
“Display Activation Link” – this option displays the activation link for the Customer user.
-
“Resend Activation” – this option sends another activation email to the user’s email address.
-
“Login as a Customer User” – this option enables the Tenant Administrator to access the Fast IoT Platform platform from the user interface of the Customer user.
-
The Tenant Administrator also has the ability to remove the Customer user from the list of customers.
Fig. 3.3 – Disable User Account
As depicted in the image below, the Tenant administrator has the option to assign the default dashboard and enable fullscreen mode.
Fig. 3.4 – Fullscreen mode selected
Similarly, as shown in the image below, the Tenant administrator may choose to assign a home dashboard to the Customer user and hide the dashboard toolbar.
Fig. 3.5 – Toolbar is hidden
IMPORTANT NOTE: Assigning a default dashboard and a home dashboard together is not necessary, as the default dashboard will be the first one a user sees upon logging into their account.
If you have any questions, please click on the question mark located in the upper right corner.
Customer User UI #
Default dashboard as the home page #
When the Customer user logs into their account, the default dashboard is the first thing they see. If the Tenant administrator sets the fullscreen default dashboard, the Customer user will see the dashboard without the left-hand menu, as demonstrated in the example below. The dashboard toolbar will always be accessible for the user, allowing them to switch to another dashboard if one is assigned and to set realtime ranges for themselves. Additionally, there is an option to export this dashboard.
Fig. 4.1 – Default dashboard
If the fullscreen mode is not selected, Customer users can switch between the left-hand menu tabs to view all the assets, devices, entities, edges, and dashboards assigned by the Tenant administrator. The following dashboard example demonstrates this functionality.
Fig. 4.2 – left-hand menu
Home dashboard as the home page #
If the Tenant administrator assigns a dashboard as the home dashboard, then the Customer user will see it on their home page. If the option to hide the home dashboard toolbar is selected, then the Customer user will see the home dashboard without the toolbar. The user can utilize the toolbar to set real-time ranges and export the dashboard.
Fig. 5.1 – If the option to hide the home dashboard toolbar is selected, then the Customer user will see the home dashboard without the toolbar.
The Customer user has the option to hide the home dashboard toolbar or change the home dashboard in their profile settings.
Fig. 5.2 – Hide home dashboard toolbar
Devices #
Fast IoT platform provides support for the following device management features through both a Web UI and a REST API.
Add and delete devices #
New devices can be registered or deleted from Fast IoT Platform by the tenant administrator.
Fig. 1 – Devices page
Manage device credentials #
The tenant administrator has the ability to manage device credentials. The current version supports credentials based on access tokens and X.509 certificates.
Fig. 2 – Device credentials
Get Device Id #
The “Copy Device ID” button allows both the tenant administrator and customer users to copy the device ID to the clipboard.
Fig. 3 – Copy device Id
Assign devices to customers #
The tenant administrator can assign devices to specific customers, which enables customer users to retrieve device data using REST APIs or the Web UI.
Fig. 4 – Assign Device to customer
Browse device attributes #
Both the tenant administrator and customer users can browse device attributes.
Fig. 5 – Device attributes
Browse device telemetry #
Both the tenant administrator and customer users can browse device telemetry data.
Fig. 6 – Device latest telemetry
Browse device alarms #
Both the tenant administrator and customer users can browse device alarms.
Fig. 7 – Device alarms
Browse device events #
Using the “Events” tab, both the tenant administrator and customer users can browse events related to a specific device. Lifecycle events and statistics will be available soon.
Manage device relations #
Both the tenant administrator and customer users can manage device relationships.
Fig. 8 – Device Relations
Device Profiles #
Overview #
The tenant administrator can configure common settings for multiple devices using Device Profiles. Each device can have only one profile at a time.
Experienced Fast IoT Platform users will notice that device types have been deprecated in favor of Device Profiles. The update script will automatically create Device Profiles based on unique device types and assign them to the corresponding devices.
Let’s take a closer look at the settings available in the Device Profile.
Device Profile settings #
Rule Chain #
By default, the Root Rule Chain handles all incoming messages and events for any device. However, as the number of different device types increases, the Root Rule Chain can become more complex. Many platform users create a Root Rule Chain specifically to send messages to different rule chains based on device type.
To avoid this tedious and time-consuming task, starting from Fast IoT Platform 3.2, you can specify a custom Rule Chain for your devices. The new Rule Chain will receive all telemetry, device activity (active/inactive), and device lifecycle (created/updated/deleted) events. This setting is available in both the Device Profile wizard and Device Profile details.
Fig. 1 – Add device profile rule chain
Queue Name #
The default behavior of the system is to utilize the Main queue to store all incoming messages and events from any device. The transport layer is responsible for submitting these messages to the Main queue, and the Rule Engine periodically checks the queue for new messages.
However, in various use cases, it may be necessary to utilize different queues for different devices. For example, you may want to separate data processing for Fire Alarm/Smoke Detector sensors from other devices. By doing so, even during peak loads generated by millions of water meters, the Fire Alarm message will be processed without delay. Moreover, having separate queues provides the flexibility to implement customized submit and processing strategies.
You can adjust this setting within the Device Profile wizard or Device Profile details.
It is important to keep in mind that if you decide to utilize a custom queue, you must first configure it with the system administrator prior to usage.
#
Fig. 2 – Add queue
Transport configuration #
The existing version of the Fast IoT Platform platform is capable of facilitating the following transport protocols: Default, MQTT, CoAP, LWM2M, and SNMP.
Fig. 3 – Transport configuration
Default transport type #
The Default transport protocol is designed to maintain compatibility with the prior releases. By utilizing the Default transport protocol, you may continue utilizing the platform’s default MQTT, HTTP, CoAP, and LwM2M APIs to establish connections with your devices. No particular configuration settings are required for the Default transport type.
MQTT transport type #
The MQTT transport protocol allows for advanced MQTT transport settings. It is now possible to define customized MQTT topic filters for time-series data and attribute updates, which correspond to the telemetry upload API and attribute update API, respectively.
The MQTT transport protocol contains the subsequent settings:
MQTT device topic filters #
The custom MQTT topic filters provide support for single ‘+’ and multi-level ‘#’ wildcards, enabling you to connect to virtually any MQTT-based device that sends a payload using JSON or Protobuf.
Fig. 4 – MQTT device topic filters
By employing the configuration depicted in the image below, you can publish time-series data using the subsequent command:
and attribute updates can be published using the subsequent command:
To transmit time-series data using MQTT protocol, follow these steps:
-
Specify the MQTT device topic filter in the Device profile.
-
Provide the basic MQTT credentials for your device, including the client id ‘c1’, username ‘t1’, and password ‘secret’.
-
Use the Terminal to publish the time-series data.
-
The transmitted data will be displayed in the “Last telemetry” tab of the device.
-
By following these steps, you will be able to transmit and monitor time-series data using MQTT protocol. Make sure to provide accurate and up-to-date information in the device profile and use secure credentials to protect your device’s data.
Fig. 5 – Specify the MQTT device topic filter in the Device profile.
Fig. 6 – Device Credentials
MQTT device payload #
By default, the platform expects devices to send data through JSON. However, it is also possible to send data through Protocol Buffers, or Protobuf, which is a language- and platform-independent way of serializing structured data. It is suitable for minimizing the size of transmitted data.
The current version of the Fast IoT Platform platform supports customizable proto schemas for telemetry payloads and attribute payloads, and implements the ability to define a schema for downstream messages such as RPC calls and attribute updates.
Fig. 7 – Select Protobuf payload type
Fig. 8 – MQTT configuration
Fig. 8 – Configuration
At the moment, Fast IoT Platform does not support certain features of protobuf such as OneOf, extensions, and maps because it dynamically parses protobuf structures.
Compatibility with other payload formats
By default, when enabled, the platform will use Protobuf payload format. In case of a parsing failure, the platform will attempt to use JSON payload format, which is useful for ensuring backward compatibility during firmware updates. For instance, the initial firmware release may use JSON, while the new release uses Protobuf. During the firmware update process for a fleet of devices, it is necessary to support both Protobuf and JSON simultaneously.
However, it is important to note that enabling the compatibility mode may cause slight performance degradation. Therefore, it is recommended to disable this mode once all devices have been updated.
Fig. 9 – Enable compatibility mode
CoAP transport type #
The CoAP transport type provides advanced settings for CoAP transport. It allows you to select the device type for CoAP.
Fig. 10 – CoAP transport type
CoAP device type: Default #
By default, the CoAP device type “Default” has a CoAP device payload set to JSON, which supports basic CoAP API, just like the Default transport type. However, it is possible to change the “CoAP device payload” parameter to “Protobuf” to send data via Protocol Buffers.
Protocol Buffers, or Protobuf, is a language- and platform-independent way of serializing structured data. It is a useful way to minimize the size of transmitted data.
The current version of the Fast IoT Platform platform supports customizable proto schemas for telemetry uploads and attribute uploads. It also allows you to define a schema for downlink messages such as RPC calls and attribute updates.
Fig. 11 – Protobuf device payload
Fig. 12 – Configuration
Fast IoT Platform dynamically parses protobuf structures, which is why it currently does not support certain protobuf features such as OneOf, extensions, and maps.
CoAP device type: Efento NB-IoT #
The present edition of the Fast IoT Platform platform is capable of integrating with the following Efento NB-IoT sensors: temperature, humidity, air pressure, differential pressure, open/close, leakage, and I/O. To use this feature, Efento devices with a firmware version of 06.02 or higher are required.
Fig. 13 – CoAP device type: Efento NB-IoT
Alarm Rules #
The Fast IoT Platform platform allows users to set up alarms using the Rule Engine feature, which is quite powerful but requires some programming knowledge. However, since Fast IoT Platform 3.2, Alarm Rules have been introduced to simplify the process of configuring alarms. This means that users do not need to be Rule Engine experts to set up processing logic for alarms. Under the hood, Rule Engine evaluates Alarm Rules using the “Device Profile” rule node.
Alarm Rules have several properties, including Alarm Type, Create Conditions, Key Filters, Condition Type, Schedule, Details, Clear condition, and Advanced settings. For example, Create Conditions specify the criteria that must be met for the Alarm to be created or updated. Severity is used to create/update an alarm and must be unique within the device profile alarm rules. Key Filters define logical expressions against attributes or telemetry values. The Condition Type can be simple, duration, or repeating. Schedule defines the time interval during which the rule is active.
To demonstrate how to use Alarm Rules, let’s consider an example where we want to monitor the temperature inside a fridge containing valuable goods. We assume that we have already created a device profile called “Temperature Sensors” and provisioned our device with a temperature sensor and an access token called “ACCESS_TOKEN”. We can upload the temperature readings using a command.
Example 1. Simple alarm conditions #
Here are the steps to create a Critical alarm when the temperature is greater than 10 degrees:
-
Open the device profile and switch to edit mode.
-
Click on the “Add alarm rule” button.
-
Enter the Alarm Type and click on the red “+” sign.
-
Click the “Add Key Filter” button.
-
Choose the “Timeseries” key type and enter “temperature” as the key name. Change the “Value type” to “Numeric”. Click “Add”.
-
Select the “greater than” operation and input the threshold value of 10. Click “Add”.
-
Click “Save”.
-
Apply the changes.
-
By following these steps, a Critical alarm will be created when the temperature is greater than 10 degrees.
Fig. 1.1 – Open the device profile and switch to edit mode.
Fig. 1.2 – Click the add alarm rule button
Fig. 1.3 – Enter the Alarm Type and click on the red “+” sign.
Fig. 1.4 – Click the “Add Key Filter” button.
Fig. 1.5 – Choose the “Timeseries” key type and enter “temperature” as the key name. Change the “Value type” to “Numeric”.
Fig. 1.6 – Select the “greater than” operation and input the threshold value of 10.
Fig. 1.7 – Click “Save”.
Fig. 1.8 – Apply the changes.
Example 2. Alarm condition with a duration #
Suppose we want to modify Example 1 to raise alarms only when the temperature exceeds a certain threshold for one minute. To achieve this, we need to edit the alarm condition and change the condition type from “Simple” to “Duration”. We should also specify the duration value and unit.
Here are the steps to follow:
-
Edit the alarm condition and change the condition type to “Duration”. Specify the duration value and unit. Save the condition.
-
Apply the changes.
By following these steps, the alarm will only be raised if the temperature exceeds the threshold for one minute.
Fig. 2.1 – Edit the alarm condition and change the condition type to “Duration”. Specify the duration value and unit.
Fig. 2.2 – Apply the changes.
To replace the 1 minute duration with a dynamic value based on device, customer or tenant settings, you can use the server-side attributes feature.
To do this, follow these steps:
-
Create a server-side attribute called “highTemperatureDurationThreshold” with the integer value of “1” for your device.
-
Save the attribute.
-
By creating this attribute, you can now use it as a dynamic value for the alarm delay in the alarm condition. This allows you to set the duration threshold for the alarm based on the device, customer or tenant settings.
Fig. 2.3 – Edit the alarm condition. Go to the dynamic value of the alarm delay by pressing the “Switch to dynamic value” button
Fig. 2.4 – Select a value: current device, current customer or current tenant.
Fig. 2.5 – Apply all changes.
Example 3. Repeating alarm condition #
Let’s say we want to modify Example 1 and only raise alarms if the sensor reports a temperature that exceeds the threshold three times in a row. To achieve this, we need to edit the alarm condition and change the condition type from “Simple” to “Repeating”. We also need to specify “3” as the “Count of events” to trigger the alarm. By default, this value will be used if no attribute is set for your device. Follow these steps to modify the alarm condition:
Step 1: Edit the alarm condition and change the condition type to “Repeating”. Specify “3” as the “Count of events” to trigger the alarm. Save the condition.
Step 2: Apply changes.
Fig. 3.1 – Edit the alarm condition and change the condition type to “Repeating”.
Fig. 3.2 – Apply changes.
Now, suppose we want to replace the set number of times the alarm condition is exceeded with a dynamic value that depends on the settings for a particular device, customer or tenant. To do this, we need to use the server-side attributes feature. Follow these steps:
Step 3: Create a server-side attribute called “highTemperatureRepeatingThreshold” with the integer value “3” for your device.
Step 4: Go to the dynamic value of the repeating alarm condition by clicking the “Switch to dynamic value” button.
Step 5: Choose whether to use the current device, current customer or current tenant settings, and specify the attribute from which the value will be taken – in this case, how many times the threshold value must be exceeded for an alarm to be triggered. You may also select “Inherit from owner” as an option. This allows the threshold value to be taken from the customer if it is not set on the device level. If the attribute value is not set on both device and customer levels, the rule will take the value from the tenant attributes.
Step 6: Save all changes.
By following these steps, the alarm condition will only trigger if the temperature threshold is exceeded three times in a row, or based on the dynamic value set by the server-side attribute for the device, customer, or tenant settings.
Fig. 3.3 – Go to the dynamic value of the repeating alarm condition by clicking the “Switch to dynamic value” button.
Fig. 3.4 – Select a value: current device, current customer or current tenant.
Fig. 3.5 – Apply changes.
Example 4. Clear alarm rule #
Suppose we want to automatically clear the alarm if the temperature in the fridge returns to normal. Follow these steps:
Step 1: Open the device profile and switch to edit mode. Then, click the “Add clear condition” button.
Step 2: Click on the red “+” sign to add a new condition.
Step 3: Add a key filter and then click “Add”.
Step 4: Save the alarm rule condition.
Step 5: Apply all changes.
By following these steps, the alarm will automatically clear if the temperature in the fridge returns to a normal level.
Fig. 4.1 – Click the “Add clear condition” button.
Fig. 4.2 – Click on the red “+” sign.
Fig. 4.3 – Add Key Filter and then click Add.
Fig. 4.4 – Apply changes.
Example 5. Define alarm rule schedule #
Suppose we want an alarm rule to evaluate alarms only during working hours. Follow these steps:
Step 1: Edit the schedule of the alarm rule.
Step 2: Select the timezone, days of the week, and time interval during which the alarm rule should be evaluated. Then click “Save”.
Step 3: Apply all changes.
By following these steps, the alarm rule will only evaluate alarms during the specified working hours.
Fig. 5.1 – Edit the schedule of the alarm rule.
Fig. 5.2 – Select timezone, days, time interval, and click “Save”.
Example 6. Advanced thresholds #
Suppose we want to allow our users to overwrite the thresholds from the Dashboard UI and add a flag to enable or disable certain alarms for each device. To accomplish this, we will use dynamic values in the alarm rule condition and two attributes: the boolean temperatureAlarmFlag and the numeric temperatureAlarmThreshold. Our goal is to trigger an alarm creation when “temperatureAlarmFlag = True AND temperature is greater than temperatureAlarmThreshold”. Follow these steps:
Step 1: Modify the temperature key filter and change the value type to dynamic.
Step 2: Select a dynamic source type and input the temperatureAlarmThreshold, then click “Update”. You may optionally check “Inherit from owner”. Inheritance allows you to take the threshold value from the customer if it is not set on the device level. If the attribute value is not set on both the device and customer levels, the rule will take the value from the tenant attributes.
Step 3: Add another key filter for the temperatureAlarmFlag, then click “Add”.
Step 4: Click “Save” and apply all changes.
Step 5: Provision device attributes either manually or via the script.
By following these steps, our users will be able to overwrite the thresholds from the Dashboard UI, and we can add a flag to enable or disable certain alarms for each device using dynamic values in the alarm rule condition.
Fig. 6.1 – Modify the temperature key filter and change the value type to dynamic.
Fig. 6.2 – Select a dynamic source type and input the *temperatureAlarmThreshold*, then click “Update”.
Fig. 6.3 – Add another key filter for the *temperatureAlarmFlag*, then click “Add”.
Fig. 6.4 – Finally, click “Save” and apply changes.
Example 7. Dynamic thresholds based on the tenant or customer attributes #
In example 6, it is shown how to enable or disable a rule based on the value of the “temperatureAlarmFlag” attribute of a single device. However, if you want to enable or disable a specific rule for all devices belonging to a tenant or customer, it can be cumbersome to configure the attribute for each individual device. To simplify this process, you can configure the alarm rule to compare a constant value with the value of the tenant or customer attribute. To do this, select the “Constant” key type and specify a value that can be compared with a dynamic value. Then, apply these changes to the configuration. This will allow you to easily enable or disable a specific rule for all devices belonging to a particular tenant or customer without having to manually configure each device.
Fig. 7 – Choose constant type and value and compare it with the value of the tenant or customer attribute.
Using the method mentioned above, it is possible to enable or disable rules and combine filters on device telemetry/attributes with filters on tenant or customer attributes.
Device profile rule node #
The device profile rule node is responsible for generating and clearing alarms based on the alarm rules defined in the device profile. By default, this node is the first one in the chain of processing. It analyzes all incoming messages and responds to the attributes and telemetry values accordingly.
Fig. 8 – Device profile rule node
The rule node has two important settings:
Persist state of alarm rules – this setting forces the rule node to store the state of processing. It is disabled by default. This setting is useful when you have duration or repeating conditions. For example, if you have a condition that states “Temperature is greater than 50 for 1 hour,” and the first event with a temperature greater than 50 was reported at 1 pm, you should receive the alarm at 2 pm (assuming the temperature conditions have not changed). However, if you restart the server after 1 pm and before 2 pm, the rule node needs to look up the state from the database. Enabling this setting, along with the “Fetch state of alarm rules” option, allows the rule node to raise the alarm. If this setting is disabled, the rule node will not generate the alarm. We disable this setting by default for performance reasons. If the incoming message matches at least one of the alarm conditions, enabling this setting will cause an additional write operation to persist in the state.
Fetch state of alarm rules – this setting forces the rule node to restore the state of processing on initialization. It is also disabled by default. This setting is useful when you have duration or repeating conditions. It should work in conjunction with the “Persist state of alarm rules” option, but on rare occasions, you may want to disable this setting while the “Persist state of alarm rules” option is enabled. If you have many devices that send data frequently or constantly, you can avoid loading the state from the database on initialization. The rule node will fetch the state from the database when the first message from a specific device arrives.
Fig. 9 – There are two important settings in the rule node.
Notifications about alarms #
If you have set up alarm rules in Fast IoT Platform, you may want to receive a notification when Fast IoT Platform creates or updates an alarm. To achieve this, you can use the outbound relation types in the device profile rule node, which include ‘Alarm Created’, ‘Alarm Severity Updated’, and ‘Alarm Cleared’. An example rule chain is shown below, but you should first confirm with the system administrator that SMS/email providers have been configured, or set up your own settings in the rule nodes.
If you need more guidance, you can refer to the existing guides available, such as the guide on how to send email on alarm (focus on the ‘to email’ and ‘send email’ nodes), or the guide on Telegram notifications. However, it is important to note that there is an additional ‘Alarm Updated’ relation type that should be ignored in most cases to avoid receiving duplicate notifications.
Fig. 10 – An example rule chain
Device provisioning #
Device provisioning enables a device to register automatically in Fast IoT Platform, either during or after the manufacturing process.
Asset Profiles #
Overview #
By utilizing Asset Profiles, the Tenant administrator can configure common settings for multiple assets. At any given moment, each asset can have one and only profile. Advanced Fast IoT Platform users might have noticed that the asset type has been deprecated in favor of the Asset Profile. The update script will automatically create Asset Profiles based on unique Asset Types and assign them to the appropriate assets.
Asset Profiles provide the ability to choose the Rule Chain and Queue to be used by the Rule Engine for processing asset data. Let’s examine the available settings within the Asset Profile.
Create Asset Profile #
To generate an Asset Profile, navigate to the Profiles tab and click on the plus icon within the Asset Profiles section to create a new profile.
Fig. 1 – Assets profiles page
Asset Profile settings #
Rule Chain #
By default, the Root Rule Chain handles all incoming messages and events for any asset. However, if you have multiple asset types, your Root Rule Chain could become increasingly complicated. Many platform users create their Root Rule Chain solely for dispatching messages to specific rule chains based on the asset type.
To alleviate the burden of this repetitive task, Fast IoT Platform introduced the ability to specify a custom Rule Chain for your assets. The new Rule Chain will handle updates to asset attributes, as well as asset lifecycle events such as Created/Updated/Deleted. You can find this setting in the Asset Profile details.
Fig. 2 – Create new rule chain
Queue #
By default, all incoming events from any asset are stored in the Main queue. The API layer sends messages to this queue, and the Rule Engine polls it for new messages. However, in certain scenarios, you may want to use different queues for different assets. For instance, you may want to segregate data processing for high-priority asset data from that of other assets or devices. This way, even if your system experiences peak load generated by millions of water meters, critical changes to important asset configurations will be processed without delay. Separating queues also enables you to customize different submission and processing strategies.
This option is available when creating an Asset Profile and in the Asset Profile details.
Fig. 3 – Select an existing queue from the list
Edges #
Web UI and REST API are utilized by Fast IoT Platform to provide support for a range of edge management features.
Add and delete edges #
The Fast IoT Platform cloud service allows the tenant administrator to register new edges or remove existing ones.
Fig. 1 – Add edge
Get edge Id, key and secret #
The tenant administrator and customer users can utilize the following buttons to copy:
-
“Copy Edge Id” button to copy Edge id to clipboard
-
“Copy Edge Key” and “Copy Edge Secret” buttons to copy Edge key and Edge secret, respectively.
Fig. 2 – Get Edge id, key and secret
Assign edge to customers #
The tenant administrator has the capability to assign specific edges to customers. This enables customer users to retrieve edge data using either REST APIs or the Web UI.
Fig. 3 – Assign edge to customers
Assign entities to edge #
The tenant administrator has the ability to assign or unassign the following groups/entities to an edge: user(s), asset(s), device(s), entity view(s), dashboard(s), and rule chain(s).
Fig. 4 – Assign entities to edge
Create edge rule chains and rule nodes #
The ability to create an edge rule engine is granted to the tenant administrator.
Make rule chain default #
The tenant administrator has the capability to set the edge rule chain as the default.
Add edge rule nodes #
The tenant administrator can include ‘Push to Cloud’ and ‘Push to Edge Nodes’ as options.
Manage edge attributes #
Both the tenant administrator and customer users have the ability to control server-side attributes for edge management.
Browse edge events #
Using the ‘Events’ tab, both the tenant administrator and customer users can view events associated with a specific edge. Each edge is equipped with a ‘Downlink’ event type that displays the message history from cloud to edge.
Manage edge relations #
The tenant administrator and customer users have the ability to manage edge relationships.
Assets #
Fast IoT Platform provides the following asset management features through its Web UI and REST API.
Add and delete assets #
The tenant administrator has the capability to register new assets on Fast IoT Platform or delete them.
Fig. 1 – Asset page
Get Asset Id #
Both the tenant administrator and customer users can copy the asset ID to the clipboard by clicking on the ‘Copy Asset ID’ button.
Fig. 2 – Get asset Id
Assign assets to customers #
The tenant administrator has the ability to assign assets to a particular customer. This enables customer users to retrieve asset data via REST APIs or Web UI.
Fig. 3 – Assign assets to customers
Manage asset attributes #
Both the tenant administrator and customer users have the capability to manage server-side attributes of assets.
Fig. 4 – Manage asset attributes
Browse asset alarms #
Both the tenant administrator and customer users have the ability to view asset alarms.
Fig. 5 – Browse asset alarms
Browse asset events #
Both the tenant administrator and customer users have the capability to view events associated with a specific asset using the ‘Events’ tab. Lifecycle events and statistics will be available soon.
Manage asset relations #
Both the tenant administrator and customer users have the ability to manage asset relationships.
Fig. 6 – Manage asset relations
Entity Views #
Feature Overview #
Entity Views (EVs) are a feature available in Fast IoT Platform (TB) since version 2.2. This feature was highly requested by TB users. Similar to SQL database views that limit the exposure of underlying tables to the outside world, TB EVs limit the degree of exposure of Device or Asset telemetry and attributes to customers. As a tenant administrator, you can create multiple EVs per Device or Asset and assign them to different customers.
Supported use cases:
-
Share specific device or asset data with multiple customers simultaneously, which was not possible before the EVs feature due to TB’s security model restrictions.
-
Allow particular customer users to view collected data (such as sensor readings), but hide debug information such as battery level, system errors, etc.
-
Device-as-a-Service (DaaS) model, where data collected by the device at different times belongs to different customers.
Architecture #
An Entity View in Fast IoT Platform contains the following information:
-
TenantId: Represents a link to the owner of the view.
-
CustomerId: Represents a link to the customer that has access to the view.
-
EntityId: Represents a link to the target device or asset.
-
Name and type: Regular Fast IoT Platform entity fields that are used for display and search purposes.
-
Start and end time: Represents the time interval used to limit access to target device telemetry. Customers will not be able to view entity telemetry outside of the specified interval.
-
Time series keys: A list of time series data keys that are accessible to the viewer.
-
Attribute keys: A list of attribute names that are accessible to the viewer.
Fig. 1 – Add entity view
Fig. 2 – Add entity view
Understanding how Fast IoT Platform (TB) handles telemetry and attribute updates and how these changes impact Entity Views is crucial.
Time series data view #
When it comes to time series data, Fast IoT Platform (TB) stores all the data in the database on behalf of the target entity without duplicating it to any of the Entity Views. When a user accesses a dashboard or makes a REST API call using the Entity View ID, the following actions occur:
The request start and end timestamps are validated and adjusted to fit within the Entity View start and end time. Therefore, if a dashboard attempts to retrieve 1 year of data, but the Entity View only allows access to 6 months of data, the request will fail.
The request time series data keys are validated and adjusted based on the time series data keys provisioned in the Entity View. Therefore, if a dashboard tries to retrieve telemetry keys that are prohibited for that specific Entity View, the request will fail.
Attributes view #
Whenever you save or update an Entity View in Fast IoT Platform, it automatically copies the specified attributes from the Target Entity. However, to improve performance, the Target Entity’s attributes are not propagated to the Entity View on every attribute change. If you want to enable automatic propagation, you can configure a ‘copy to view’ rule node in your rule chain and link the ‘Post attributes’ and ‘Attributes Updated’ messages to the new rule node.
Fig. 3 – you can configure a ‘copy to view’ rule node in your rule chain and link the ‘Post attributes’ and ‘Attributes Updated’ messages to the new rule node.
Future improvements
The Fast IoT Platform Road Map includes the following planned updates:
-
Adding the option to enable or disable RPC (Remote Procedure Call) requests in the device view.
-
Allowing the configuration of a specific list of alarms that can be accessed or propagated for a particular view.
#
Bulk Provisioning #
Bulk Provisioning Overview #
Fast IoT Platform offers the capability to perform bulk provisioning using a CSV file for various types of entities, including:
-
Devices
-
Assets
The various entities could possess the subsequent parameters:
Entities can possess the following parameters:
-
Attributes: Static and semi-static key-value pairs linked with the entities. Examples include serial number, model, and firmware version.
-
Telemetry data: Time-series data points that are accessible for storage, querying, and visualization. Examples include temperature, humidity, and battery level.
-
Credentials: Used by the device to connect with the Fast IoT Platform server through applications that run on the device.
Import Entities #
In order to create multiple entities simultaneously, it is necessary to generate a CSV file, in which each line will be responsible for creating one entity with given parameters. If certain settings are not required for a particular entity, the corresponding cell can be left empty.
Furthermore, there are three reserved parameter names – “Name,” “Type,” and “Label” – that have predefined column types.
Step 1: Select a file #
To import data, upload a CSV file to the system.
Fig. 1 – Import device
Fig. 2 – Select a file
Step 2: Import configuration #
After uploading the file, the subsequent parameters must be configured:
-
CSV delimiter: The character that separates the values in the data line.
-
First line contains column names: If this option is enabled, the first line of the file will be utilized as the default values for the parameter names in the next step.
-
Update attributes/telemetry: If this parameter is activated, the parameter values will be updated for all entities whose names match existing entities in the Fast IoT Platform system. Alternatively, an error message will be displayed for all entities whose names already exist in the Fast IoT Platform system if this parameter is disabled.
Fig. 3 – CSV delimiter
Step 3: Select columns type #
In this stage, it is necessary to establish a connection between the columns of the uploaded file and the corresponding data types in the Fast IoT Platform platform. Additionally, the default name for attribute/telemetry key can be set or modified.
Fig. 4 – Select columns type
Fig. 5 – Select columns type
Step 4: Creating new entities #
Input data is being processed.
Step 5: Done #
The outcome of the query execution displays the total number of created/updated entities, along with the number of errors that occurred during the execution process.
Fig. 6 – Successfully imported.
Fig. 7 – İmported devices.
Use case #
Suppose we want to simultaneously create 10 devices and assign them an access token.
Sample file:
Note: The file must contain a minimum of two columns: entity name and type.
The CSV file editor was used to create the file, which includes data for 10 devices. Additionally, the “Data2” parameter has been omitted for Device 5, and will not be created for that particular device.
Upload file #
Go to Devices -> Import device
Upload sample file: test-import-device.csv
Import configuration #
To configure the uploaded file, follow these steps:
-
CSV delimiter: Choose the separation symbol used in your editor. In the sample file, the delimiter is “,”.
-
First line contains column names: This option should be left selected since the sample file contains column names.
-
Update attributes/telemetry: Since we are adding new devices instead of updating existing devices in the Fast IoT Platform platform, uncheck this option.
Select columns type #
The first column of the table displays the first line of data in the uploaded file. Since the “First line contains column names” checkbox was selected in the previous step, the values for the third column have already been initialized based on the first line of the document.
To make changes, modify the third row’s column type to “Timeseries” and set the attribute/telemetry key value to “Temperature”. The last row in the table is responsible for the token, so change the “Server” attribute to “Access token”.
Note: Only one row can have the column types of “Name”, “Type”, and “Access token”.
Import finished #
Upon completion of the creation process, statistics information will be displayed. In the following example, it can be seen that 8 devices were created successfully, while 2 devices encountered an error during the creation process. The reason for the error is that Device 1, Device 2, and Device 3 have the same token in the provided sample file, which is prohibited by the Fast IoT Platform system.
Rule Chains #
The Rule Chains Administration UI page presents a table of configured tenant rule chains. You can perform the following operations:
-
Import or create a new Rule Chain.
-
Export a Rule Chain to JSON.
-
Mark a Rule Chain as the Root Rule Chain.
-
Delete a Rule Chain.
Fig. 1 – Rule chains page
Rule Chains import/export #
Rule Chain export #
To export a rule chain in JSON format, you can go to the Rule Chains page and locate the specific rule chain you wish to export. Then, click on the export button that can be found on the row corresponding to the rule chain. This will allow you to save the rule chain configuration in JSON format, which can then be imported into the same or a different Fast IoT Platform instance as needed.
Fig. 2.1 – Rule Chain export
Rule import #
To import a rule chain, you can go to the Rule Chains page and locate the “+” button in the top-right corner of the Rule chains table. Clicking on this button will open a menu where you can select the “Import rule chain” option. From there, you can choose the JSON file containing the rule chain configuration that you wish to import.
Fig. 2.2 – Rule import
Note 1: When you import a Rule chain, it will not be a Root Rule Chain by default.
Note 2: If the imported Rule Chain includes references to other Rule Chains (via a Rule Chain node), you will need to update these references before saving the Rule Chain.
Troubleshooting #
There may be some issues when importing a rule chain, such as references to other Rule Chains via a Rule Chain node that need to be updated before saving any changes.
Dashboards #
Prerequisites #
To facilitate a quicker learning process and better understanding of this guide, it is recommended that you first follow the Getting Started guide to familiarize yourself with Fast IoT Platform devices and dashboards.
Introduction #
Fast IoT Platform offers a feature to create and manage dashboards, which can contain numerous widgets. Dashboards are used to display data from various entities, such as devices, assets, and more, and can be assigned to customers. This guide will cover the main concepts and various configuration settings related to creating and managing dashboards.
Adding a dashboard #
If you want to create a new dashboard, follow these steps:
-
Access the Dashboards section by using the main menu located on the left-hand side of your screen.
-
Look for the “+” sign located in the upper right corner and click on it.
-
A dialog box will open where you need to provide a title for your new dashboard. You can optionally add a description as well.
-
Finally, click on the “Add” button to complete the process.
Fig. 1.1 – Dashboard page
Fig. 1.2 – Add dashboard
Make public #
To share a dashboard publicly and obtain a link to it, follow these steps:
-
Go to the Dashboards section.
-
Select the dashboard that you want to share and click on the “Share” icon located next to it.
-
Confirm that you want to make the dashboard public by clicking on “Yes” in the dialog box.
-
Click on the dashboard to open its details.
-
In the dashboard details section, click on the “Copy” button next to the public link.
-
You can now share the dashboard with others using the link that you have copied.
Remember to make any related devices, assets, and entity views public as well so that others can access their data.
Fig. 1.3.1 – Make public
Fig. 1.3.2 – Make private
Dashboard overview #
Before you start working with a dashboard, become familiar with its interface to understand which features are responsible for which actions.
Title #
The editable title of the dashboard is located in the top-left corner. The dashboard title is also displayed in the application breadcrumbs to facilitate navigation. You can modify and adjust the title in the dashboard settings.
Edit mode #
To enter dashboard edit mode, use the “pencil” button located in the bottom-right corner of the screen. Once in edit mode, you can add new widgets and access controls from the dashboard toolbar. You can also use the “Apply changes” button to save any changes made or the “Decline changes” button to undo any unsaved changes.
Fig. 2.1 – Edit mode
Fig. 2.2 – You can use the “Apply changes” button to save any changes made or the “Decline changes” button to undo any unsaved changes.
Toolbar #
The dashboard toolbar provides access to various features such as managing states, layouts, settings, aliases, filters, and configuring the time window, using the corresponding icons in the toolbar.
Some of the icons, such as stats, layout, and settings, are only visible in the “edit” mode, while all other icons are visible in both “view” and “edit” modes. You can choose to hide these icons or configure the toolbar to be minimized by default using the settings.
Fig. 3.1 – Dashboard toolbar
Fig. 3.2 – Edit mode toolbar
Entity Aliases #
Entity aliases determine which entities (devices, assets, etc.) will be displayed on the dashboard. You can treat an alias as a reference to one or more devices, and these references can be either static or dynamic.
An example of a static alias is the single entity alias, where an entity is configured once in the alias dialog box. All users who have permission to access the device will see the same data.
An example of a dynamic alias is the device type alias, which displays all devices of a certain type (e.g., “Thermometer”). This alias is dynamic because the list of devices depends on the user who is accessing the dashboard. If you are logged in as a tenant administrator, this alias will resolve to all thermometer devices. However, if you are logged in as a customer user, this alias will resolve to thermometer devices that are assigned/owned by that customer.
Fig. 4.1 – Add entity alias
Fig. 4.2 – Add alias
Fig. 4.3 – Save alias
Entity Filters #
Entity filters enable you to specify criteria for filtering the list of entities that are resolved by the entity alias. To illustrate, consider a scenario where you have thousands of Thermometer devices, and you want to display only those that meet specific conditions, such as having a particular model and battery level. Let’s assume that the thermometer model is stored as an attribute, and the battery level is stored as a time series data. In this case, you can define a filter that checks if the model is “DHT22” and the battery level is below 20 percent.
It is worth noting that when adding the filter, you have the option to allow users to edit it by adjusting the slider next to the Filter name.
Filters are only applied to the most recent value of an attribute or time series key. This feature should not be used to exclude historical time series values.
You can create “complex” filters by combining multiple logical expressions for a single key. For instance: “(A > 0 and A < 20) or (A > 50 and A < 100)”. Additionally, you can combine two expressions for different keys using the “and” operator, such as: “(A > 0 and A < 20) and (B > 50 and B < 100)”.
At this time, it’s not possible to use the “or” operator to combine different keys, such as: “(A > 0 and A < 20) or (B > 50 and B < 100)”.
Fig. 5.1 – Add entity filter
Fig. 5.2 – Add filter
Fig. 5.3 – Add key filter
Fig. 5.4 – Add new key filter
Fig. 5.5 – New key filter
Fig. 5.6 – Click add button.
Fig. 5.7 – Save filter
Widgets #
Widget types #
All IoT dashboards on Fast IoT Platform are created using widgets, which can be found in the Widget Library. Each widget provides various end-user functions such as data visualization, remote device control, alarm management, and displaying custom HTML content.
There are five types of widgets available:
-
Time series widgets are used to display data for a specific time window. This window can be either real-time (e.g., the last 24 hours) or historical (e.g., December 2020). Chart widgets are an example of a time series widget, and they are designed to display time series data rather than attribute data.
-
Latest value widgets display the most recent values of a particular attribute or time series key. For example, a device model or the latest temperature reading.
-
Control widgets enable you to send Remote Procedure Call (RPC) commands to your devices, allowing you to control various aspects of their operation. For instance, you can use control widgets to set the desired temperature on a thermostat device.
-
Alarm widgets allow you to display alarms generated by devices or the Fast IoT Platform system.
-
Static widgets are designed to display static data, such as a floor plan or company information that doesn’t change frequently.
Adding widget to the dashboard #
To add a widget to your Fast IoT Platform dashboard, you should follow these steps:
-
Click on the pencil icon located in the bottom right corner of the screen to switch to Edit mode.
-
Click on the big sign in the center of the screen or on the “+” icon in the bottom right corner of the screen to open the “Add new widget” dialog box.
-
Click on “Create new widget” to open the “widget selection” dialog box.
-
Choose the widget bundle you want to use, for example, “Charts”.
-
To quickly find the widget you want, use the search bar by clicking on the magnifying glass icon and entering the name of the widget.
-
Select the widget you want to use, such as “Time Series Line Chart”.
-
Click on the widget to open the “Add Widget” dialog box.
Fig. 6.1 – Create new widget
Fig. 6.2 – Click charts widget
Fig. 6.3 – Select Timeseries Line Chart
Widget dialog and settings #
A widget on Fast IoT Platform is made up of the widget type, one or more data sources, basic and advanced settings, and actions that can be added. As a result, the “Add Widget” dialog box has four tabs for defining a widget. It’s worth noting that only the data source configuration is essential. In most cases, you can leave all other configuration tabs with their default values.
1. Widget data settings #
Widget data settings are used to add one or multiple data sources to a widget. A data source is a combination of a data source type, an entity alias, an optional filter, and a list of data keys (entity time series). The data source determines which entities the widget should use (based on the alias and filter), and which data keys should be fetched for those entities.
Fig. 7.1 – Add entities table widget
As an example, suppose we want to configure a data source to fetch temperature and humidity values for all “Thermometer” devices with the model “DHT22” and a battery level of less than 20%. We will use the “Thermometer” alias and the “Low battery DHT22 Thermometers” filter, which we configured in the previous section of this document.
Fig. 7.2 – Entities datasource
In the example mentioned earlier, “temperature” and “humidity” are two data keys that belong to the time series. The list of data keys available for a data source depends on the widget type:
-
Time series widgets allow you to choose time series data keys and the time window in the data source.
-
Latest values widgets allow you to choose time series, attributes, and entity fields.
-
Static and Control widgets do not require a data source.
-
Alarm widgets allow you to choose all data keys, including time series, attributes, entity and alarm fields. Additionally, you can configure the time window and alarm filter.
Suppose you do not have the required time series or attribute key in the database. In that case, you can still add a key to the data source, and the widget will start displaying the data as soon as the device sends it to Fast IoT Platform.
Fig. 7.3 – If the necessary time series or feature key is not yet available in the database, you can still add the key to the data source.
Additionally, you have the option to select the symbol to display next to the value and specify the number of digits after the floating-point number. These settings can be applied to all axes if desired. For instance, if you are displaying temperature readings for several devices, you can add the symbol ‘°C’ or ‘°F.’ However, if you are showing both temperature and humidity, you need to configure these data keys separately using the data key settings.
Fig. 7.4 – Data settings
Another option you have is to define an alternate message that will be shown if the widget doesn’t receive any data. Once data is received, the message will disappear and the incoming data will be displayed instead.
Fig. 7.5 – You may specify alternative message in this field
Fig. 7.6 – Alternative message that will be displayed if widget doesn’t have incoming data.
2. Widget data source types #
-
Entity data source
To fetch data from a specified entity alias, you can use the Entity data source feature. Here’s an example of how to use this feature to display all existing devices on a dashboard widget:
Open the dashboard and enter edit mode by clicking the pencil icon in the lower-right corner of the screen.
Click on the “Entity alias” button located on the toolbar, then select “Add alias” in the lower-left corner of the Entity alias dialog box.
In the “Add alias” dialog box, provide an alias name and select the filter type as “Entity type”. Choose the relevant entity type (in this example, Device entity type). Click on the “Add” button to create the alias.
Finally, save the created alias by clicking on the “Save” button located in the lower-right corner of the dialog box.
Fig. 8.1 – Add entity alias.
Fig. 8.2 – Save alias.
With the entity alias created, you can use it as a data source to display data related to the specified entity type. In this example, you can use the alias to display a list of all the existing devices on the dashboard widget.
A widget has been added that displays all devices using the entity data source.
Fig. 8.3 – Click add new widget
Fig. 8.4 – Select cards widgets bundle
Fig. 8.5 – Select entities table widget
Fig. 8.6 – Add datasources
Fig. 8.7 – Apply changes
-
Entity count data source
Fast IoT Platform has introduced a new feature called Entity count data source, which allows users to display the number of entities on a widget and easily determine the number of devices, assets, etc.
To demonstrate this feature, let’s create a widget that displays the total number of existing devices:
-
Open a dashboard and enter edit mode by clicking on the pencil icon in the lower-right corner of the screen.
-
Click on the “Entity alias” button on the toolbar, then select “Add alias” in the lower-left corner of the Entity alias dialog box.
-
In the “Add alias” dialog box, provide an alias name and select the filter type as “Entity type”. Choose the relevant entity type (in this example, Device entity type). Click on the “Add” button to create the alias.
-
Finally, save the created alias by clicking on the “Save” button located in the lower-right corner of the dialog box.
Fig. 8.8 – Add alias
With the entity alias created, you can now use the Entity count data source to display the number of entities. To do this:
-
Click on the “Add new widget” button in the middle of the screen.
-
Select the Cards widget bundle, and choose the Entity count widget.
-
Select the previously created entity alias from the “Entity type” dropdown.
-
Customize the widget as desired and click “Add” to add it to the dashboard.
Now you have a widget that displays the total number of existing devices based on the entity alias you created earlier.
To display the data after adding an alias, you need to add a widget. Here are the steps to do that:
-
Click on the “Add new widget” button in the center of the screen.
-
Select the Cards widget bundle.
-
To quickly find the desired widget, use the search bar by clicking on the magnifying glass icon and typing the name of the widget you’re looking for. For displaying the number of entities, the Simple card widget is suitable.
-
Customize the widget as desired and click “Add” to add it to the dashboard.
To include a new data source, follow these steps:
-
Choose the Entities count type, and then select the alias of the entity that was added earlier.
-
If you want to modify the label, click on the pencil icon. In the resulting dialog box, you can change the label’s name, adjust its color, personalize a unique symbol that will appear next to the data, and indicate the number of decimal places to display. Save the changes by clicking the “Save” button at the bottom-left corner of the dialog box.
-
After finishing the customization of the data source, click on the “Add” button located in the lower-left corner of the Add widget dialog box.
Fig. 8.9 – Click add new widget.
Fig. 8.10 – Select cards widget bundle.
Fig. 8.11 – Select Simple card widget
Fig. 8.12 – Simple crad datasources
Fig. 8.13 – Change label name by clicking the pencil sign.
The device counting widget has been added, but the default special symbol of the widget (C°) is still present. To remove it, follow these steps:
-
Enter the widget edit mode.
-
Go to the Settings tab.
-
Find the Special symbol line and delete the current special symbol or replace it with the desired one.
-
Additionally, you can specify the number of digits after the decimal point.
-
After making the changes, be sure to save them by clicking the orange checkmark located in the top-right corner of the dialog box.
Fig. 8.14 – Enter widget edit mode
Fig. 8.15 – Data settings
Fig. 8.16 – Total count of devices
We now possess a widget that exhibits the total count of devices currently in existence.
-
Function data source
The function data source is utilized when no data is available, but you wish to test the visualization of a widget. For instance, suppose you haven’t assigned an alias or received any telemetry, but you want to observe how a widget represents data.
To display data, the following steps need to be taken:
-
Add a widget by clicking the “Add new widget” icon located in the center of the screen.
-
Choose the Cards widget bundle.
-
For entity visualization, select the Entity table widget as it is the most appropriate option.
It is now time to incorporate a data source into the system. To do this, select the Entity type and choose the alias of the entity that was previously added. Then, click on the “Save” button located in the lower-left corner of the dialog window to confirm your selection.
Once you have customized the data source to your liking, click on the “Add” button located in the lower-left corner of the Add widget dialog box to proceed. By utilizing the widget that has the function of displaying data from the specific data source, we can determine how the widget will present the information.
Fig. 8.17 – Click add new widget
Fig. 8.18 – Select cards widgets bundle
Fig. 8.19 – Select entities table widget
Fig. 8.20 – Datasources
Fig. 8.21 – Apply changes.
3. Data keys #
The data key is used to specify the time series, attribute or entity field that you want to utilize in the widget. The definition of a data key includes the type (time series, attribute, or entity field) and the actual key value.
The available attribute keys list includes all the client, server, and shared attributes of your device or entity.
The available time series keys list depends on the time series data that your devices report to Fast IoT Platform or that you have saved through the rule engine or REST API.
The list of entity fields depends on the type of entity and may be expanded in the future. Devices, assets, and entity views have fields such as create time, entity type, name, type, label, and additional information. Users have fields like created time, first name, last name, email, and additional information. Customers have fields such as create time, entity type, email, title, country, state, city, address, zip code, phone, and additional information.
3.1. Basic data key settings
In the basic settings of a data key, you have the option to customize several parameters. These include changing the name and color of the key, modifying the label name, setting a special symbol to display next to the value (applicable only to the Timeseries key), specifying the number of decimal places to display, and enabling or disabling the “Use post-processing function” option.
To illustrate, let’s examine an example of the basic data key settings for the Entities table from the Cards bundle.
-
Key. You have the ability to alter the name of the key. By specifying the key name in the “Key” field, data associated with that particular key will be displayed. After changing the key name, click on “Save”. It is important to note that there are three types of keys: Attributes, Time Series, Entity Field, and Alarm Field (only for Alarm widget). To ensure that data is correctly displayed, it is crucial to change the key name to match an existing key of the same type. If the desired time series or attribute key does not yet exist in the database, you can still add it to the data source. The widget will begin displaying data as soon as the device sends it to Fast IoT Platform.
Fig. 8.22 – Current key.
-
Label. To customize the data column name in your widget, you can modify the label name. Simply enter the desired name for the label and click on “Save” located in the lower right corner of the dialog box.
Fig. 8.23 – Current label.
-
Color. Each key in a widget is assigned a distinct color. In certain widgets, such as the Chart widget, the color of the graph line displayed in the widget corresponds to the color of the key. To modify the color of a key, click on the colored circle associated with the key, select the desired label color, and click on “Select”.
Fig. 8.24 – Current color
-
To display a special symbol next to the value in your widget, you can specify the desired character in the corresponding field. After entering the desired character, click on “Save”.
Fig. 8.25 – Special symbol to show next to value.
Fig. 8.26 – Special symbol next to value are displayed
-
If you want to customize the number of digits to be displayed after a floating-point number in your widget, you can specify the desired number in the corresponding field. Once you have entered the desired value, click on “Save”.
Fig. 8.27 – Number of digits to be displayed after a floating-point
Fig. 8.28 – Specify the desired number in the corresponding field.
Aggregation of key
Starting from version 3.4.2, additional aggregation functionality has been added to Fast IoT Platform. By default, the Latest Values widgets do not have a time window. However, if you enable aggregation for any data key in the Latest Values widget, the time window control will appear. This allows you to set up aggregation for each telemetry key individually that you wish to display, without needing to store it in the database. The time window configuration is limited to real-time intervals such as Current Hour/Day/Month, as well as History time intervals. For performance reasons, real-time intervals such as ‘last 30 minutes’ or ‘last 24 hours’ are not supported.
Fig. 8.29 – Aggregation of key
Fig. 8.30 – Average Aggregation
Aggregation options:
-
Min or Max: This function selects the minimum or maximum value within a given interval. It can be used to detect peak negative or positive values, such as power surges in a power cable, air pollution levels, equipment workload, and so on.
Fig. 8.31 – Max Aggregation
-
Average: This function calculates the average value from the selected interval by summarizing and dividing it by the count of telemetry from the same interval. It can be used for various purposes, such as calculating the weekly fuel consumption, measuring the acoustical noise in decibels, monitoring the rotation fan speed, evaluating the signal quality, and so on.
Fig. 8.32 – Average Aggregation
-
Sum: This function summarizes all telemetry data for the specified period. It can be used for various purposes, such as calculating the total mileage in kilometers, monitoring water consumption, tracking idle time, and so on.
Fig. 8.33 – Sum Aggregation
-
Count: This function calculates the total number of messages transmitted during the selected period. It can be useful for setting up and optimizing battery-powered devices, evaluating the sensor activation sensitivity, and so on.”
Fig. 8.34 – Count Aggregation
The delta function is a useful tool for computing the difference between aggregated values over a specific time interval and corresponding values for a relative time window interval.
The “Comparison period” is a parameter that utilizes the historical interval as a reference and adjusts it based on the chosen option. There are several options available, with the default being the “Previous interval.” This option considers not only the time period but also the type of interval, such as “Current day” or “Current day so far.”
-
For example, if the selected option is “History – Current month so far,” the interval will be from 1.09.22 to 25.09.22, and the previous interval will be from 1.08.22 to 25.08.22.
Fig. 8.35 – The delta function.
-
“The ‘Day ago‘ option subtracts 24 hours from the start and end of the historical interval. For instance, when calculating the water consumption for the ‘Current day’ and ‘Delta – Day ago’ options:”
Fig. 8.36 – Day ago comparison period.
-
One week ago refers to an interval that is 168 hours earlier than the current day’s interval. For example, if we are looking at average data for a specific metric, the history interval would be the period leading up to the current day. The week ago delta would be the same metric but for the interval that occurred one week prior to the current day’s interval.
-
When we refer to “month ago,” we are talking about an interval that has the same duration as the history interval, and it is subtracted from the current history interval. For example, if the current month is February, which has 28 days, the “month ago” interval would be the previous 28 days, not the entire previous month.
For instance, if we are analyzing the total amount of water consumed, the history interval would be the period leading up to the current day. The “Month ago” delta would be the same metric but for the 28-day interval that occurred one month prior to the current history interval.
-
“When we talk about ‘year ago,’ we are referring to an interval that occurred 365 days prior to the current history interval.
If we need to make a comparison, we can consider aggregating data for the previous month and the corresponding month from the past year.”
-
The ‘Custom interval‘ option allows us to set individual intervals as per our specific requirements. The maximum allowed value for this option is limited to the ‘int’ data type. For instance, an example of setting a custom interval could be using the value ‘7200000’ to indicate a 12-hour interval.
Fig. 8.37 – Custom interval otion
The Delta calculation result option allows us to specify how we want the result to be displayed:
-
Previous Value: This displays the aggregation value of the compared interval, not the current history interval.
-
Delta (absolute): This displays the difference between the compared intervals, and it is set as the default option.
-
Delta (percent): This displays the result as a percentage relative to the previous interval. The formula used for this option is: (IntervalValue – prevIntervalValue)/prevIntervalValue*100.
We can also use the data post-processing function to modify the output data based on our requirements. To use this function, we need to check the “Use data post-processing function” checkbox and enter the desired function in the field below. Finally, we need to click on the “Save” button located in the lower-right corner.
3.2. Advanced data key settings
The ‘Advanced data keys configuration’ is responsible for determining the visibility, style, and appearance of a specific data key column on a widget. This feature is available for the Entity Table Widget, Alarms Table Widget, and Entity Admin Widget bundles, which share the same advanced data key configuration. However, the Charts Widget Bundle has its own unique advanced data key configuration. On the other hand, all other widget bundles only have basic data key configuration options available.
4. Widget time window #
A widget time window specifies a time interval and aggregation function that should be used to retrieve time series or alarm data. By default, each widget utilizes the primary time window defined in the dashboard toolbar. However, the default time window can be overridden by checking the “Use dashboard timewindow” checkbox. Moreover, if we wish to hide the time window selection for a particular widget from the user, we can do so by selecting the “Display timewindow” checkbox.
Fig. 8.38 – Time window configuration.
To learn more about time window configuration, please follow this link.
5. Alarm filter #
Apart from configuring the time window, alarm widgets also offer the option to filter alarms based on their status, severity, and type. Users can select a combination of alarm statuses and severity to filter alarms. Additionally, specific alarm types can also be defined, and the search of propagated alarms can be enabled as well.
Fig. 8.39 – Alarm widget filters
Fig. 8.40 – Added alarm filters.
Basic widget settings #
Assuming that you have added the “Timeseries Line Chart” widget to display thermometers using only the widget data configuration step, you will see a similar widget. Please note that to see the actual lines in the chart, you need to send or simulate some data.
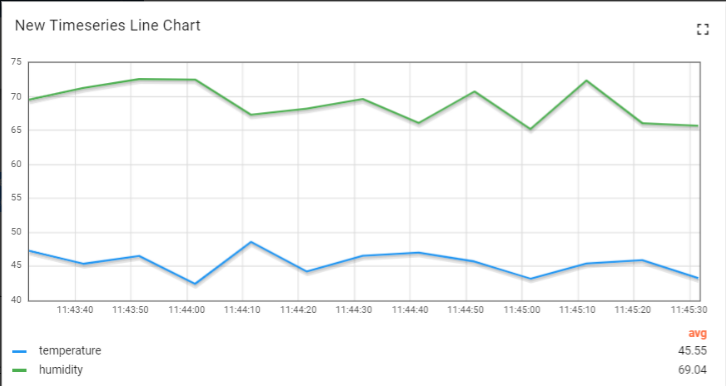
Fig. 8.41 – Timeseries Line Chart widget
We will use the basic widget settings to personalize the widget and illustrate the impact of each setting on the widget.
1. Widget Title #
Customizing the widget title, tooltip, and title style is possible, and you can also add an icon to the title while controlling its color and size. The following shows how to configure these settings and their corresponding result.
Fig. 8.42 – Widget Title settings
Fig. 8.43 – Title style from this screen.
2. Widget Style #
The widget can be personalized further by customizing its style using CSS properties, which will be applied to the main div element of the widget.
Furthermore, you have the option to disable the widget shadow by selecting the “Drop shadow” checkbox and disable fullscreen using the “Enable fullscreen” checkbox. Note that these settings are enabled by default.
You can also adjust the background color, text color, padding, and margin of the widget. Refer to the configuration and the corresponding result below.
Please keep in mind that the style and background color shown here are just examples and do not necessarily follow our guidelines.
Fig. 8.44 – Widget style settings
Fig. 8.45 – Result
Widget style as shown in the image above:
3. Legend settings #
For chart widgets, the “Display legend” option is enabled by default, which displays the minimum, maximum, average, and total values. Other widgets, however, have this option disabled.
While the legend is displayed, you can choose its direction, position, and which data to include (min, max, average, total), and you may also choose whether to sort the data keys.
It is important to note that the legend displays the data key label for each configured data key. When multiple devices are included in the same widget, it may be difficult to identify which device corresponds to which record in the legend or tooltip. To ensure clarity in both the legend and tooltip, you can use “${entityName}” or “${entityLabel}” in the data key configuration.
Refer to the configuration and corresponding result below:
Fig. 8.46 – Legend settings
Fig. 8.47 – Configuring the label of your entity
4. Mobile mode settings #
The Mobile Mode settings include two options:
-
Order – This is set to an integer that specifies the priority of the widget order to be displayed in mobile mode. Note that all widgets are displayed in a single vertical column in mobile mode. You can customize the order of widgets by assigning different order values for each widget.
-
Height – This option takes an integer value between 1 and 10, which sets the height of the widget in Mobile Mode within the range of 70px (1) to 700px (10), irrespective of its original height. For example, if the value is set to 5, the widget’s height will be 350px (70 * 5). If no value is specified, the widget’s original height will be used.
Fig. 8.48 – Mobile mode settings
Advanced widget settings #
The advanced widget settings are unique to each widget implementation and provide precise customization options. For instance, the “Timeseries – Flot” widget allows you to configure line style and width, enable comparison with the previous time interval, and utilize entity attributes in the legend.
Widget actions #
Actions make it easy and quick to configure state transitions, navigate to other dashboards, or update the current dashboard. The available action sources vary depending on the widget, but the type of action you can select remains the same for all widgets. To configure actions, you must switch to the Edit mode of the widget. To fully understand how to use Actions, you need to add a State to your widget.
For more information on widget actions, refer to the dedicated documentation.
Time window #
The dashboard time window refers to the time range and aggregation function utilized to retrieve time series or alarm data. The time window is employed by all time series and alarm widgets, unless they have been specifically configured to override it.
For a time series widget, Fast IoT Platform retrieves telemetry with a timestamp that corresponds to the time window. For an alarm widget, Fast IoT Platform fetches alarms created within the time window.
The time window operates in two modes:
-
Real-time mode – In this mode, widgets receive continuous updates from the server and display data that corresponds to the current timestamp within the time window.
-
History mode – In this mode, widgets receive data only during the initial load and no further updates are received over WebSockets.
Fig. 9.1 – Realtime mode
Fig. 9.2 – History mode
The data aggregation function is used only for time series data and is not applicable for alarms. There are currently five available aggregation functions: Min, Max, Average, Sum, and Count. The special function None is used to disable aggregation. Aggregation is useful when you don’t want to fetch all time series data to the UI and want to pre-aggregate it at the database level. Using aggregation functions reduces network bandwidth and computation power of the client browser. We recommend using aggregation functions whenever possible if you have a large number of raw values.
Starting from version 3.2.2, you can use predefined intervals such as Current Day, Previous Day, Previous Month, etc., in addition to the last X minutes/hours/days. Note that the Current Day interval represents 24 hours (from midnight to midnight the next day), whereas the Current Day So Far represents the time from midnight until the time when the time window was updated. All other intervals are distinguished in the same way.
Fig. 9.3 – Real time interval mode – current day
Fig. 9.4 – Real time interval mode – current day so far
In some cases, the time intervals may be long, and you may want to examine the data in more detail without changing the timestamps. To achieve this, you can use the zoom feature. To zoom in, hold down the right mouse button and move it over the chart to the area you want to examine more closely. To return to the original size of the chart, double-click on the widget.
Time zone configurations are introduced in Version 3.2.2. By default, the dashboard uses the time zone provided by the browser. However, it is now possible to set the time zone for your browser or a specific country. You can quickly find the desired time zone by typing its name in the time zone bar.
Fig. 9.5 – Timezone
Settings #
The Dashboard settings enable you to customize and enhance the overall appearance of the Dashboard. To begin customizing the Dashboard for an improved user experience, the first step is to enter Edit mode by clicking the “Pencil” icon located at the bottom right of the page (Enter edit mode).
Fig. 10.1 – Entering the settings mode.
Once you have entered the Edit mode, you can open the Dashboard Settings by clicking on the “Gear” icon located at the top of the window.
State controller #
The first customizable feature is the State Controller. By default, it is set to “entity,” so to ensure that all features are available and that the Dashboard is as user-friendly as possible, it is recommended to leave it as is.
Leave toolbar opened #
The “Leave toolbar opened” checkbox controls the display of the toolbar on the Dashboard page. This toolbar enables various functions such as switching between different dashboards, editing the time window, exporting the dashboard, and expanding it to full screen.
If the checkbox is unchecked, the toolbar will be hidden. In its place, you will see a three-dot icon located in the upper right-hand corner of the screen. Clicking on this icon will reveal the previously hidden toolbar.
Fig. 10.2 – Keep toolbar opened
Fig. 10.2 – Hide toolbar
Title of the Dashboard #
To view the Dashboard Title, you must select the “Display dashboard title” checkbox. The default text color for the title is black. You can easily adjust the color and transparency by using the “Title color” parameter. To choose a different color, simply click on the colored circle and move the slider to the desired color. The modified title will then appear on the top left corner of the Dashboard.
Fig. 10.3 – Change title color
Fig. 10.4 – Title settings
Dashboard Toolbar Settings #
The checkboxes for “Display Dashboard selection,” “Display entities selection,” “Display filters,” “Display timewindow,” and “Display export” determine the visibility of the respective options on the Dashboard toolbar panel.
The “Filters” option is only displayed on the toolbar panel when it has been created. If a filter has been created, but you wish to restrict the user’s ability to modify the device’s indicators, you can disable the option to see filters on the toolbar panel by unchecking the corresponding checkbox.
Fig. 10.5 – Toolbar settings
Fig. 10.6 – Dashboard toolbar
Color #
The “Color” line determines the color of the text messages that may appear while editing your Dashboard. You can adjust the color by clicking on the colored circle to the left of the line. This will open a small window where you can move the sliders to adjust the color and transparency of the text. The default color is black. For example, if no widgets have been added to the dashboard yet and you change the color, the message “Add new widget” will also change accordingly.
Capacity #
-
Columns count
When you are editing your Dashboard and adjusting the size and positioning of widgets, you may notice a whitish grid on a grey background. These are columns that determine how many widgets can fit horizontally on the Dashboard. By default, there are 24 columns, but you can increase or decrease their number as needed. The minimum number of columns is 10, and the maximum is 1000.
Fig. 10.7 – Layout settings
-
Margin between widgets
The margin type determines the amount of space between widgets. By default, the margin is set to 10. You can remove it by setting the “Margin between widgets” line to 0, or you can increase the margin to create more distance between widgets. The maximum margin allowed is 50.
Fig. 10.8 – Margin between widgets
-
Auto fill layout height
The “Automatic Fill Layout Height” checkbox is unchecked by default, allowing you to adjust the size of widgets freely. If you check this option, all the widgets on the Dashboard will automatically fill in the vertical space of the screen.
Fig. 10.9 – Auto fill layout height
Background settings #
Background color #
To customize the background color of your Dashboard, you can use the “Background color” option. Click on the colored circle to open the color picker and adjust the color and transparency using the sliders. Once you have chosen the desired color, click “Save” to apply the changes. After saving, you will see the new customized background color on your Dashboard.
Fig. 10.10 – Background color
Background image #
This option enables you to set an image as your Dashboard’s background. You can do this by either dragging and dropping an image into the designated field or uploading one from a folder on your computer. Once you have selected the image, a preview will appear on the left side of the Settings window. To adjust the image’s position more precisely, click the drop-down menu and select how the picture will fill the background space. For example, you can choose “Cover” and then click “Save” to see how the background has changed.
Fig. 10.11 – Background image
Mobile layout settings #
By default, the “Automatic Fill Layout Height” checkbox is unchecked on mobile devices, which allows you to freely adjust the size of the widgets. If you check this option, all the widgets on the Dashboard will automatically fill in the vertical space of the screen.
The “Mobile row height” setting determines the height of the widgets on your mobile device. By default, the height is set to 70px, but you can adjust it to be smaller or larger. The minimum mobile row height is 5px, and the maximum is 200px.
Layouts #
To arrange widgets on a Dashboard, you can use layouts. To manage a layout, click the “Pencil” icon at the lower right corner of the screen to enter the Edit mode. Once you’re in the Edit mode, click on the small “Manage layouts” button with three rectangles in the upper left corner of the Dashboard window. This will open a small window for controlling the layouts.
Fig. 11 – Manage layouts
The Main layout is the primary layout that you are currently managing. Essentially, it’s your Dashboard. If you click on the large blue square button labeled “Main”, the Layout Settings window will open. The layout settings are similar to the Capacity and Background settings of the Dashboard.
If you check the “Right” checkbox, the Dashboard will be divided into two separate sections. For each section, you can configure their own settings and interface.
Fig. 12 – Manage layouts | divider
To demonstrate the varying appearances that can be achieved, we will configure both layouts in completely distinct manners. The accompanying screenshot highlights the differences in settings between the two layouts (note that this is merely an illustration and not a suggestion). Once you have made the necessary adjustments, click on the “Save” button located in the Layouts window to view the updated versions.
Fig. 13 – Apply changes.
States #
The States feature is designed to help you create a hierarchical structure in your Dashboard. To utilize States effectively, you should assign a specific action to a widget that allows you to quickly navigate between the required states. To begin, click on the button with two-layered squares located in the upper left corner, labeled “Manage dashboard states”. This will open a window with dashboard state configuration options.
Since you haven’t created any states yet, you only have the “Root state”, which represents your Dashboard’s main state. Once you have created additional states, you can easily change the root state by clicking on the “Pencil” icon (Edit dashboard state) and selecting the “Root state” checkbox.
To add a new state, simply click on the “+” button located in the upper right corner of the window, which will open a small window for creating a new state. Give the state a name, and a State ID will be automatically generated based on the name, although you can modify it if needed.
Fig. 14 – Manage dashboard states
Fig. 14 – Add dashboard state
A specific action needs to be assigned to a widget in order to navigate between states. To add an action, click on the “pencil” icon (Edit widget) located in the upper right corner of the widget to access the widget configuration field. From there, navigate to the “Action” cell and click on the “+” icon to add a new action. This will open the “Add action” window.
-
The Action source refers to a particular task that needs to be completed in order to achieve an objective.
-
The Name field allows you to choose a preferred title for the action.
-
The Icon field enables you to choose a symbol to represent the action.
-
The Type field determines the objective of the action.
In our scenario, the Type field should be set to “Navigate to new dashboard state”. Once this option is selected, the “Target dashboard state” line will appear, prompting you to choose a newly created state. Once you have completed the configuration for the new state, click on the “Save” button. The new state will now be displayed in the Action list. Click the orange check mark located in the upper right corner of the window to apply the changes.
Since we have selected the “On row click” action, we need to click on the row of our widget to activate the action. After clicking, we will be immediately transferred to the selected state.
Fig. 15 – Edit entities table
Fig. 16 – Add action
Fig. 17 – Action details
Fig. 18 – Apply changes.
To name a state after an entity, use ${entityName} as the state name. This way, when the action is triggered, you will be taken to a state that has the same name as the entity that was involved in the action.
Fig. 19 – Add dashboard state
Fig. 20 – Add action
Import dashboard #
To import a dashboard in JSON format, follow these steps: Go to the Dashboard group and click on the “+” button located in the upper right corner of the page. From there, select “Import dashboard”. This will bring up the dashboard import window, where you will be asked to upload the JSON file and then click the “Import” button to begin the import process.
Fig. 21 – Import dashboard
Fig. 22 – Select file
Export #
In Fast IoT Platform Community Edition, you can export a dashboard or a specific widget as a configuration file in JSON format. This file can then be used to transfer your dashboard or widget configuration to another instance of Fast IoT Platform.
Export dashboard #
To export a dashboard in Fast IoT Platform Community Edition, follow these steps:
-
Go to the Dashboards section and locate the dashboard you wish to export from the list.
-
Click on the “Export dashboard” button located opposite the name of the dashboard in the list.
-
A configuration file in JSON format containing all the settings on the control panel will be saved on your computer.
Fig. 23 – Export dashboard
To export a dashboard in Fast IoT Platform, you can do so directly from the dashboard. Simply open the dashboard and click on the “Export dashboard” button located in the upper right corner of the screen.
Fig. 24 – Export dashboard
Export widget #
To export a widget in Fast IoT Platform Community Edition, follow these steps:
-
Go to the dashboard where the widget is located.
-
Click on the “Pencil” icon located in the lower right corner of the screen to enter edit mode.
-
Find the widget you want to export and click on the “Export widget” button located in the upper right corner of the widget.
-
This will save a configuration file in JSON format containing all the settings for the widget to your computer.
Widgets Library #
Introduction #
Fast IoT Platform IoT Dashboards are built using widgets from the Widget Library. Each widget offers different end-user functionalities, including data visualization, remote device control, alarm management, and the display of custom static HTML content.
Widget Types #
Each widget in Fast IoT Platform is designed to provide specific features, which define the widget type. There are five main types of widgets available in Fast IoT Platform:
-
Latest values widget: This type of widget displays the latest values of device attributes or telemetry.
-
Timeseries widget: This widget displays the historical values of device attributes or telemetry in a graphical format.
-
RPC (Remote Procedure Call) widget: This widget provides a way to send commands to a device and receive the response.
-
Alarm widget: This widget displays device alarms and their current state.
-
Static widget: This widget is used to display custom HTML content, which is not related to device data.
Fig. 1 – Widgets
Fig. 2 – Alarm widget
Fig. 3 – Control widgets
For each widget type in Fast IoT Platform, there is a specific data source configuration and corresponding API widget. Every widget requires data sources to visualize data. The available types of data sources depend on the widget type, and include:
-
Target device – used in the RPC widget to specify the target device.
-
Alarm source – used in alarm widgets to display alarms and their corresponding fields from a source entity.
-
Entity – used in both time-series and latest values widgets. It requires specifying the target entity, time series key, or attribute name.
-
Entities count – used in latest values widgets to specify the target entity.
-
Function – used in both time-series and latest values widgets for debugging. It allows specifying a JavaScript function to simulate device data for visualization.
Latest values #
The Latest Values widget type displays the most recent values of a particular entity attribute or time series data point (such as the Gauge Widget or Entities Table widget). These widgets use entity attribute(s) or time series values as data sources. For example, the Digital Gauge widget displays the current temperature value.
Fig. 4 – Digital gauges widget
Fig. 5 – Select digital thermometer
Fig. 6 – Add widget.
Fig. 7 – Apply changes.
Time series #
The Time Series widget type displays historical values for a selected time period, or the latest values within a certain time window (such as the Timeseries Line Chart or Timeseries Bar Chart). These widgets use only entity time series values as their data source. To specify the time frame of the displayed values, Time Window settings are used. The time window can be set on the dashboard page or in the widget details, and can be either real-time – dynamically changing time frames for a certain interval – or historical – a fixed time frame from the past. All of these settings are part of the Time Series widget configuration. In the example provided, the Timeseries Line Chart displays the real-time speed value of a device.
Fig. 8 – Select Timeseries Line Chart widget
Fig. 9 – These widgets use only entity time series values as their data source
RPC (Control widget) #
The Control widget enables sending Remote Procedure Call (RPC) commands to devices and handles and displays the device’s response (such as the Raspberry Pi GPIO Control widget). RPC widgets are configured by specifying the target device as the endpoint for RPC commands. In the provided example, the Basic GPIO Control widget sends GPIO switch commands and detects the current status of the GPIO switches.
Fig. 10 – Select GPIO widgets
Fig. 11 – Select Basic GPIO Control
Fig. 12 – Target device
Fig. 13 – Apply changes
Alarm Widget #
An Alarm widget is a type of display that presents alarms related to a specific entity within a specified time window, similar to an “Alarms table.” The widget is configured by selecting an entity as the source of the alarm and specifying the relevant alarm fields. Like Time series widgets, Alarm widgets allow users to configure the time frame for the displayed alarms.
The Alarm widget’s configuration includes parameters for “Alarm status,” “Alarm severity,” and “Alarm type.” The “Alarm status” parameter specifies the status of the alarms being retrieved. The “Alarms severity” parameter controls the frequency at which alarms are retrieved, measured in seconds. The “Alarm type” parameter helps to distinguish between different types of alarms and identify their root cause. For instance, “HighTemperature” and “LowHumidity” are two distinct alarms that can be identified through this parameter.
The “Alarms table” widget example displays the latest alarm for the device in real-time, providing users with up-to-date information on the device’s status.
Fig. 14 – Select alarms table widget
Fig. 15 – Alarms table details
Static #
The Static widget type is designed to show customizable HTML content that remains fixed (e.g., “HTML card”). These widgets don’t rely on any data sources and are typically configured by specifying the desired static HTML content and, optionally, CSS styles. For instance, the “HTML card” is an example of a Static widget that displays specified HTML content.
Fig. 16 – Select HTML Card widget
Fig. 17 – HTML and CSS content
Fig. 18 – Apply changes.
Widgets Library (Bundles) #
Widget bundles are grouped according to their intended purposes and are classified as either System-level or Tenant-level Widgets. Upon installation of Fast IoT Platform, a basic set of system-level Widget bundles is included.
System-level bundles can be managed by the System administrator and are available for use by any tenant in the system. Conversely, Tenant-level bundles can only be accessed by the tenant and their customers and can be managed by the Tenant administrator. Should you want to add your own widgets, you can do so by following the instructions outlined in the guide.
Fig. 19 – Widgets Bundles
Fig. 20 – Widgets Bundles
Alarm widgets #
The bundle of alarm widgets can be beneficial for displaying alarms related to particular entities, whether in real-time or historical modes.
Fig. 21 – Alarm widgets
Analog Gauges #
The Analog Indicators package is designed to provide visualization for temperature, humidity, speed, and other integer or decimal values.
Fig. 22 – Analog Gauges
Cards #
The Card package is useful for visualizing time-series data or attributes in table or card widgets.
Fig. 23 – Cards
Charts #
The Charts bundle is designed to provide visualization for historical or real-time data within a specified time window.
Fig. 24 – Charts
Control widgets #
The Control Widgets bundle is designed to provide visualization of the current state and allow for sending RPC commands to target devices.
Fig. 25 – Control Widgets
Date widgets #
The Date Widgets bundle allows users to modify the date range for other widgets on the dashboard.
Fig. 26 – Date widgets
Digital Gauges #
The Digital Gauges bundle is designed to provide visualization of temperature, humidity, speed, and other integer or float values.
Fig. 27 – Digital Gauges
Entity admin widgets #
The Entity Admin Widgets are pre-designed templates of complex widgets that enable users to create, update, delete, and list devices and assets.
Fig. 28 – Entity admin widgets
Gateway widgets #
The Gateway Widgets bundle is designed to facilitate the management of extensions.
Fig. 29 – Gateway widgets
GPIO widgets #
The GPIO Widgets bundle is designed to provide visualization and control of GPIO state for target devices.
Fig. 30 – GPIO widgets
Input widgets #
The Input Widgets bundle is designed to allow users to modify the attributes of an entity.
Fig. 31 – Input widgets
Maps widgets #
The bundle of map widgets is valuable for displaying the geographical positions of devices and monitoring their routes in real-time and historical modes.
Fig. 32 – Maps widgets
Navigation widgets #
The bundle of navigation widgets is helpful in establishing the user’s home dashboard.
Fig. 33 – Navigation widgets
Scheduling widgets #
The bundle of scheduling widgets is beneficial for scheduling different kinds of events with adaptable schedule configurations. This feature is exclusively available in PE and PaaS.
Adding widgets bundle #
If a system administrator adds a new bundle of widgets, it automatically becomes a system bundle, meaning that only the administrator has the authority to delete, edit, and add widget types to the bundle. Tenant administrators are also able to create widgets bundles, but they only have permission to modify the ones they create. You can always implement and add your own widgets by following the instructions in this guide.
To create a new bundle of widgets, you should:
-
Go to the widgets bundle page via the main menu on the left-hand side.
-
Click the “+” icon in the upper right-hand corner of the screen and choose “Create new widgets bundle” from the drop-down menu.
-
In the pop-up dialog box, enter the name of the new bundle. Adding an image and a description is optional.
-
Click “Add” to save the changes you have made.
-
Please note that since widgets bundles are arranged in alphabetical order, the newly created one may appear on the second page.
-
Once you have added the widgets bundle, you can add different types of widgets to it.
Fig. 34 – Create new widgets bundle
Fig. 35 – Add new widget bundle
Fig. 36 – Please note that since widgets bundles are arranged in alphabetical order, the newly created one may appear on the second page.
Fig. 37 – Select widget type
Widgets Bundles export/import #
Widgets Bundle export #
You can export a bundle of widgets in JSON format and import it into the same or a different instance of Fast IoT Platform.
To export a bundle of widgets, follow these steps:
-
Go to the Widgets Library page.
-
Click the export button on the row of the specific widgets bundle you want to export.
Fig. 38 – Export widget
Widgets Bundle import #
Importing a bundle of widgets is very similar to exporting it. To import a bundle of widgets, follow these steps:
-
Go to the Widgets Library page.
-
Click the “+” button in the upper right-hand corner of the “Widgets Bundles” page.
-
Select “Import widgets bundle” from the drop-down menu.
-
A window for importing widgets bundles should pop up, prompting you to upload the JSON file.
-
Drag and drop the file from your computer, and click “Import” to add the widget bundle to the library.
Fig. 39 – Import widgets bundle
Fig. 40 – Select file
Widget Types export/import #
It is possible to export a particular type of widget from a widget bundle in JSON format and then import it into the same or different Fast IoT Platform instance.
Widget Type export #
To export a specific widget type, you should follow these steps:
-
Go to the Widgets Library page.
-
Open the desired widgets bundle.
-
Click the export button on the card of the particular widget type you want to export.
Fig. 41 – Export widget
Widget Type import #
Only system administrators have the authority to modify system (default) widget bundles, including deleting the system widget bundle, editing and deleting widgets inside the bundle, and adding or importing new widgets into the bundle. If a new widget bundle is created at the system administrator level, it will be displayed in the accounts of their tenants as a system bundle, and the tenants will not be able to modify it. However, tenants can create their own widget bundles and have full rights to manage created widget types within the bundle.
To import a widget type, follow these steps:
-
Go to the Widgets Library page.
-
Open the widget bundle.
-
Click the “+” button in the lower right-hand corner of the screen.
-
Click the import button.
-
In the import widget type window, a popup will appear and prompt you to load the JSON file.
-
Drag and drop the file from your computer and click “Import” to add a widget type to the bundle.
Fig. 42 – Click the “+” button in the lower right-hand corner of the screen.
Fig. 43 – Click the import button.
Fig. 44 – Select and import file.


